Chlorophyll concentrations are an important yardstick to measure water quality by. It serves a way to measure the amount of algae in the water. The concern with algae is when the conditions are right there can be a bloom. When a bloom occurs it can lead to oxygen depletion when the algae dies and starts to decompose the decomposition process consumes large amounts of oxygen and can cause oxygen depletion which in turn can kill fish, shellfish & crustaceans. /this is the process responsible for the Mississippi dead zone. A bloom is not a desirable outcome and it is why monitoring and controlling the nutrient levels in the water is critical to the long term health of a water body.
Chlorophyll is measured in micro-grams/liter (ug/L). For Chlorophyll above 5ug/l is considered elevated, over 10ug/L is indicative of an algae bloom, sustained levels over 10 ug/L is indicative of eutrophic conditions, over 20 ug/L is the EPA benchmark for poor water quality.
Sections:
Wellfleet Harbor Composite
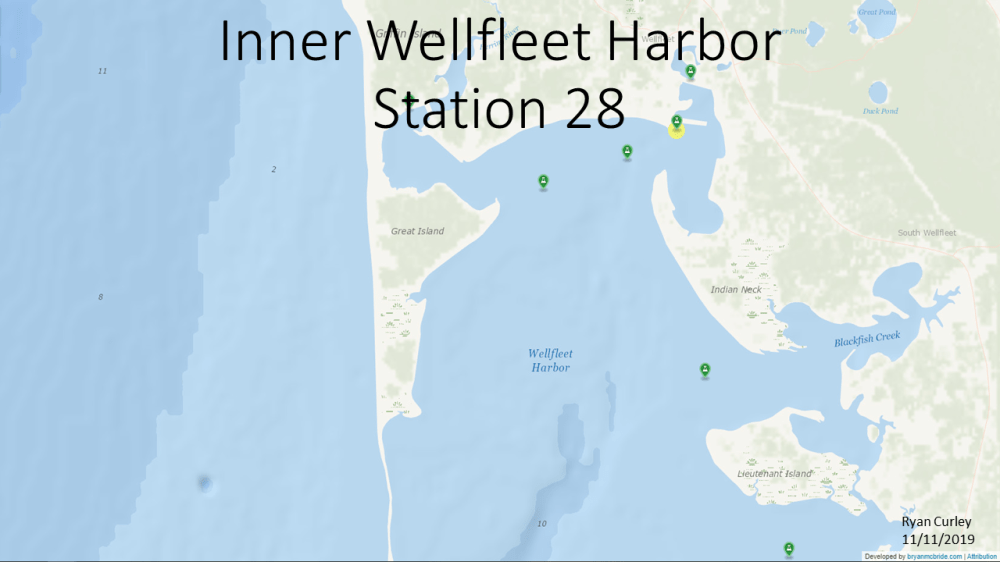
Inner Wellfleet Harbor
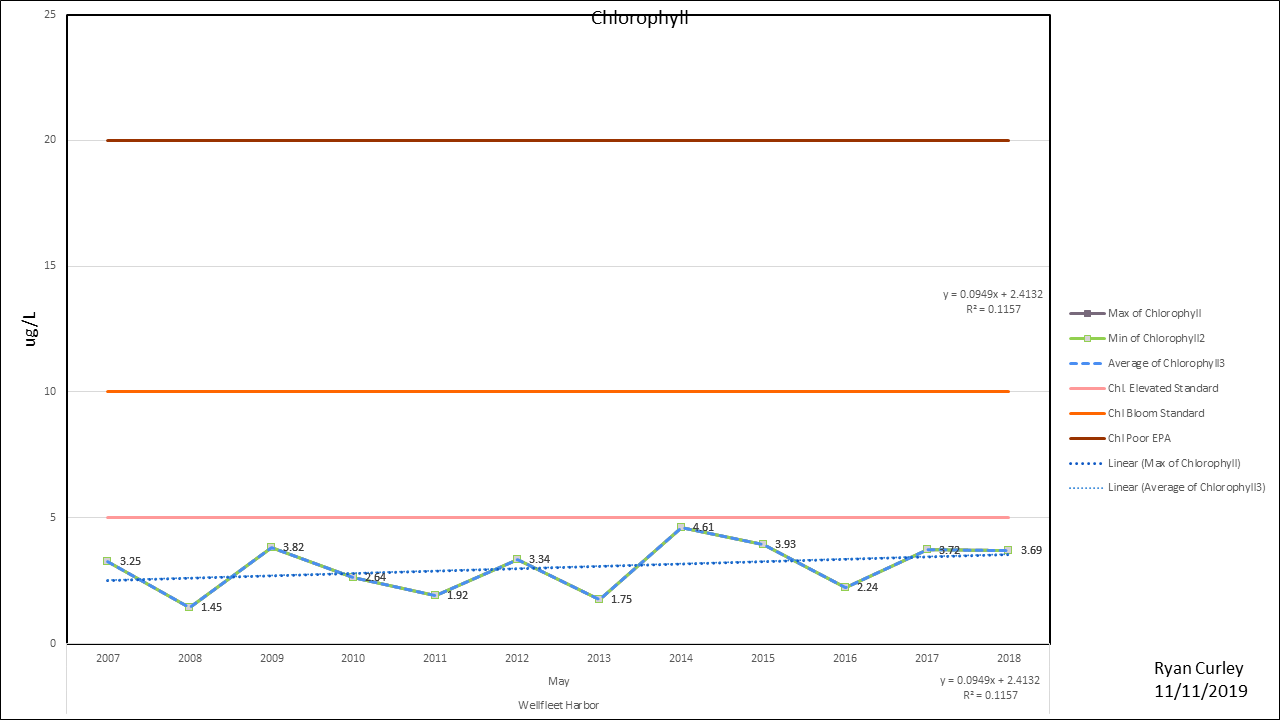
Wellfleet Harbor
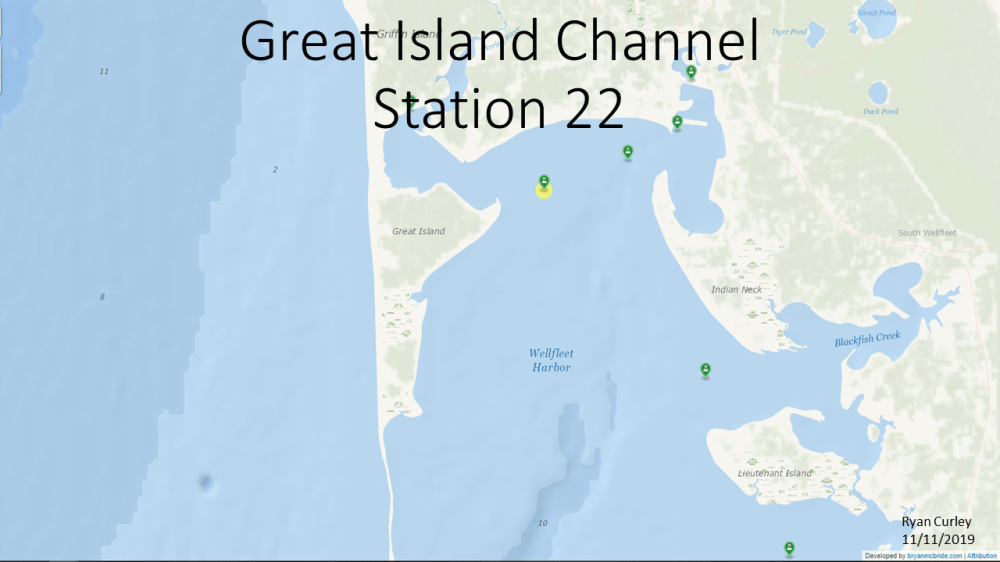
Great Island Channel
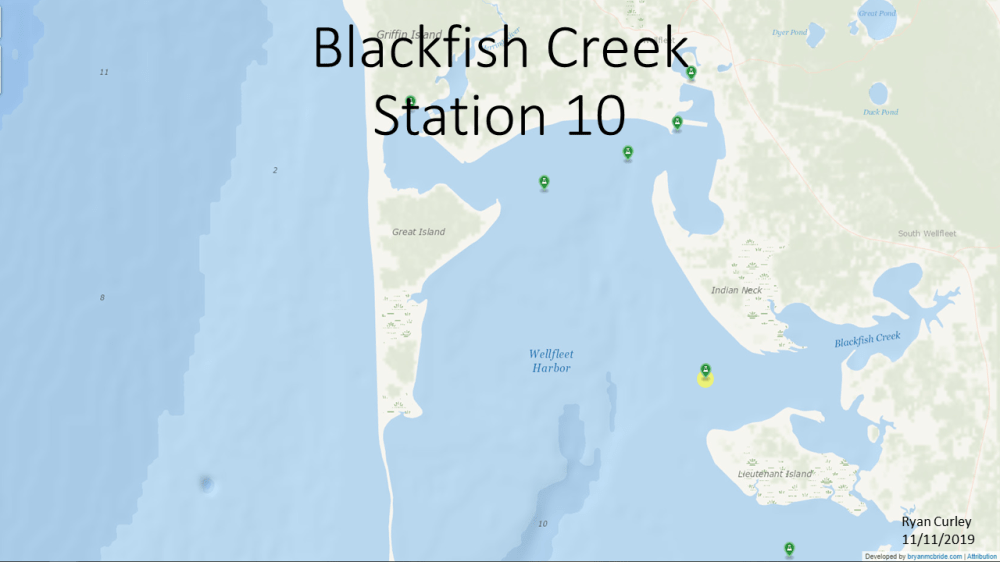
Blackfish Creek
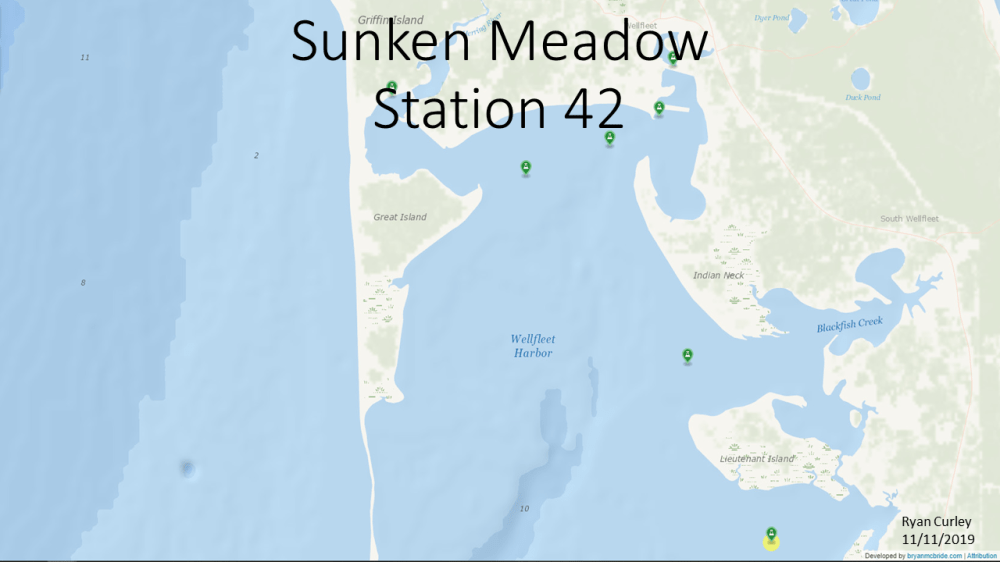
Sunken Meadow/ South Lt. Island
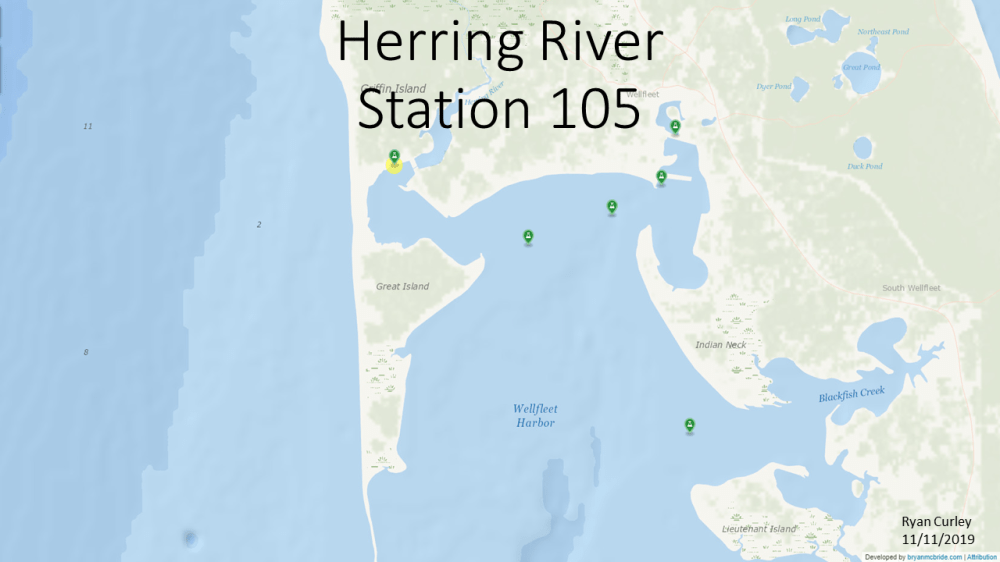
Herring River
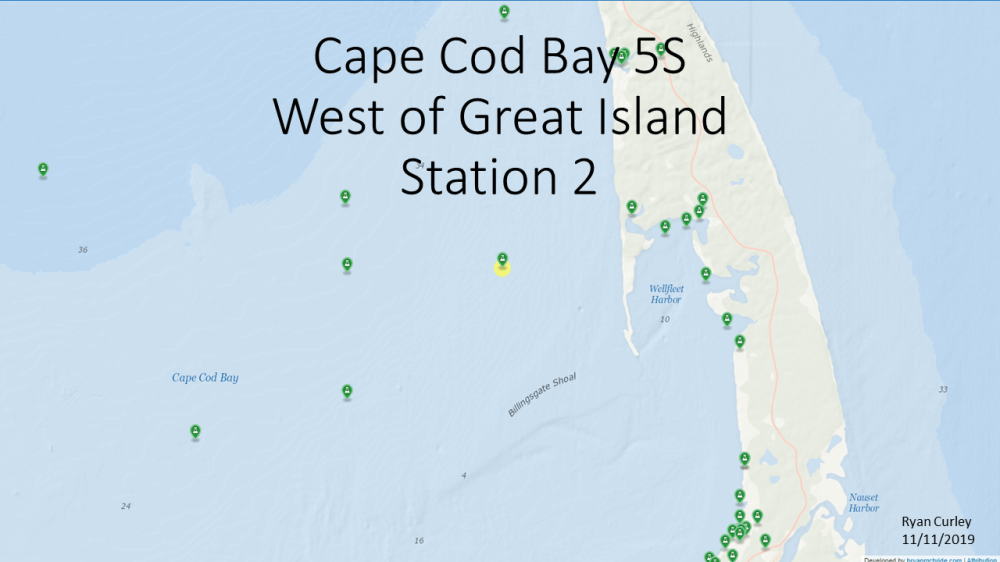
Cape Cod Bay Station 5S
Duck Creek (Note there are significant data gaps in Duck Creek’s Chlorophyll data)
Wellfleet Harbor has nine locations where water sampling is carried out by the Center for Coastal Studies. The sampling season is typically May through October, with the exception of the Herring River where year round sampling started in the fall of 2017. May and October typically have one water sample taken per station. From June though September there are typically two samples taken per station. Water conditions vary greatly by month. Nitrogen concentrations typically are highest during the summer. To compensate for the variability water quality has been broken out by station and month. CCB 5S has year round sampling.
Wellfleet Harbor Composite
To produce a larger sample size it is necessary to combine the results of multiple stations. Wellfleet Harbor Composite is the combined data of Blackfish Creek, Great Island Channel, Inner Wellfleet Harbor, Wellfleet Harbor, and Outer Sunken Meadow (directly south from Lt. Island). It most accurately reflects the water quality of Wellfleet Harbor as a whole. WH5 station’s data starts in 2017 so it is included in the Composite only where it will not skew the results so it is used for averages but not for counts.
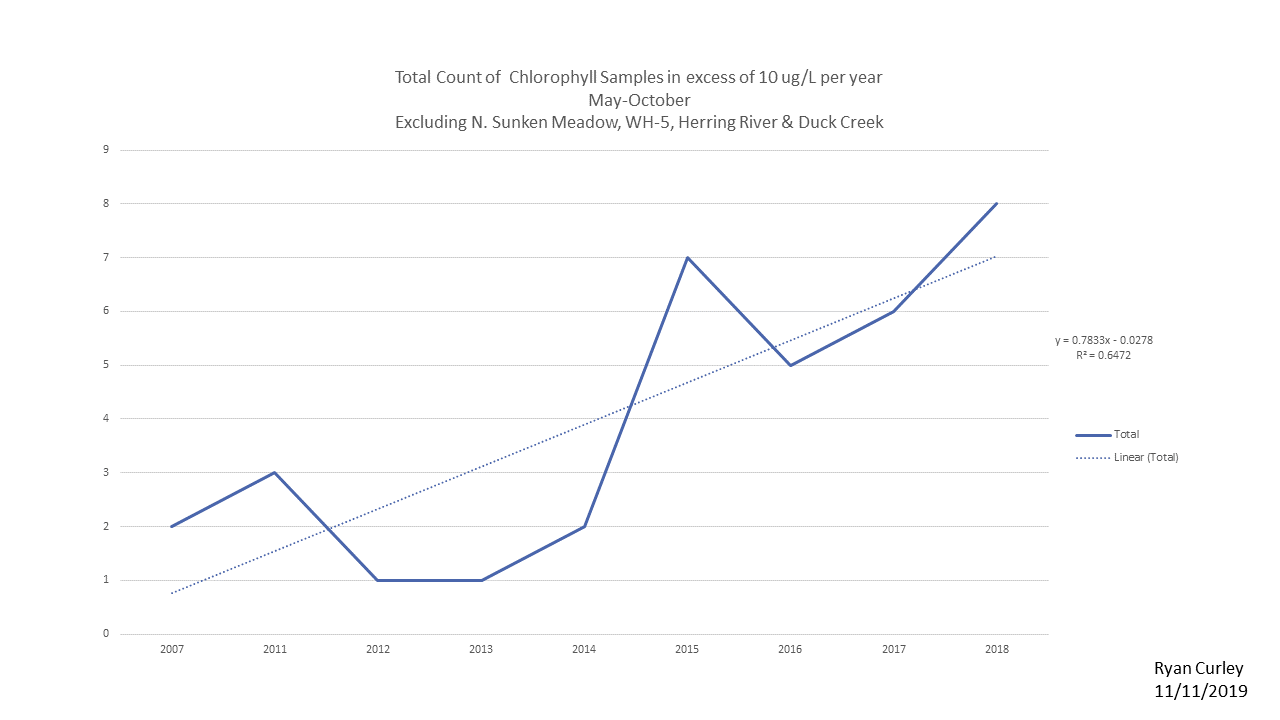
Excludes, Herring River, Duck Creek (Data Gaps), N. Sunken Meadow (Data Gaps), & WH-5 (single season of data) 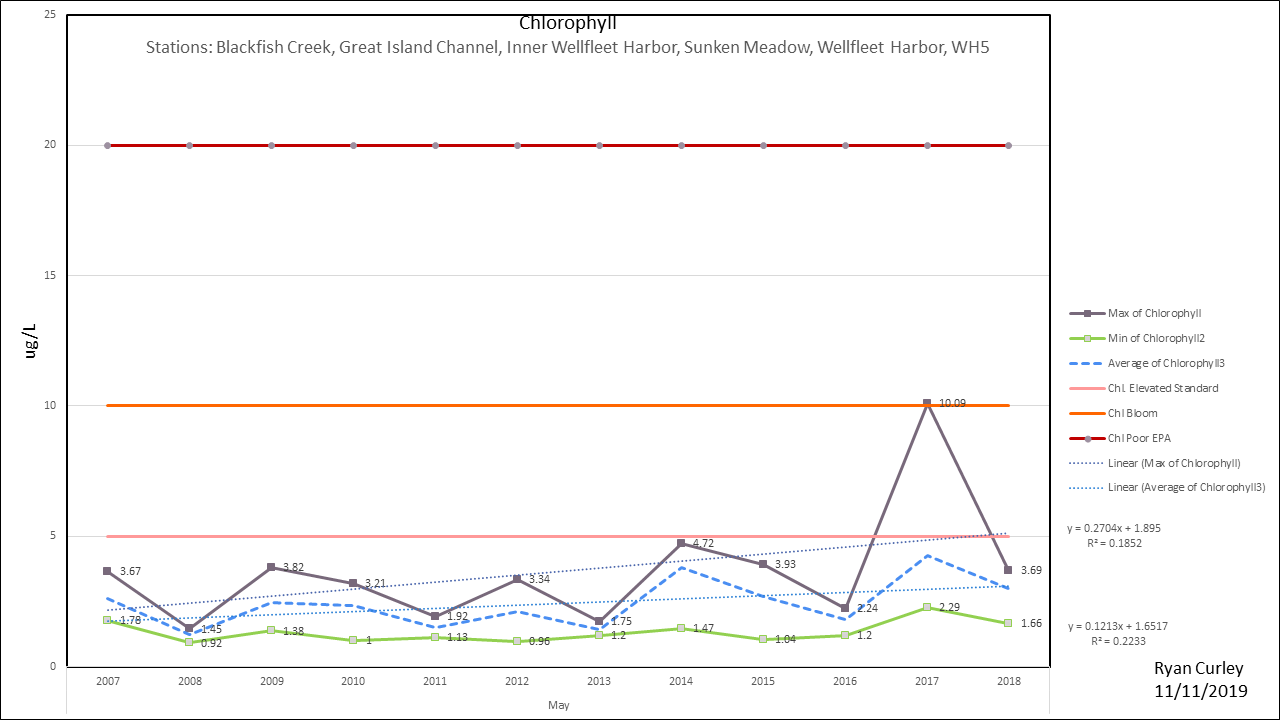
May 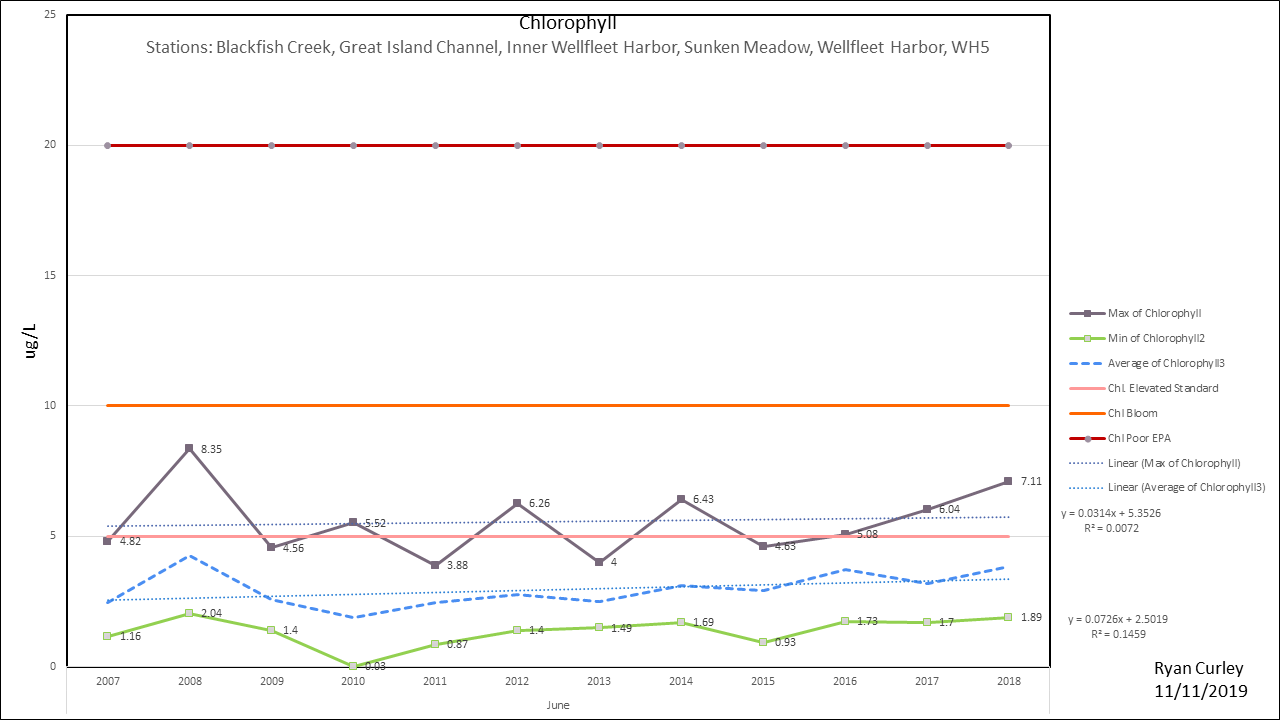
June 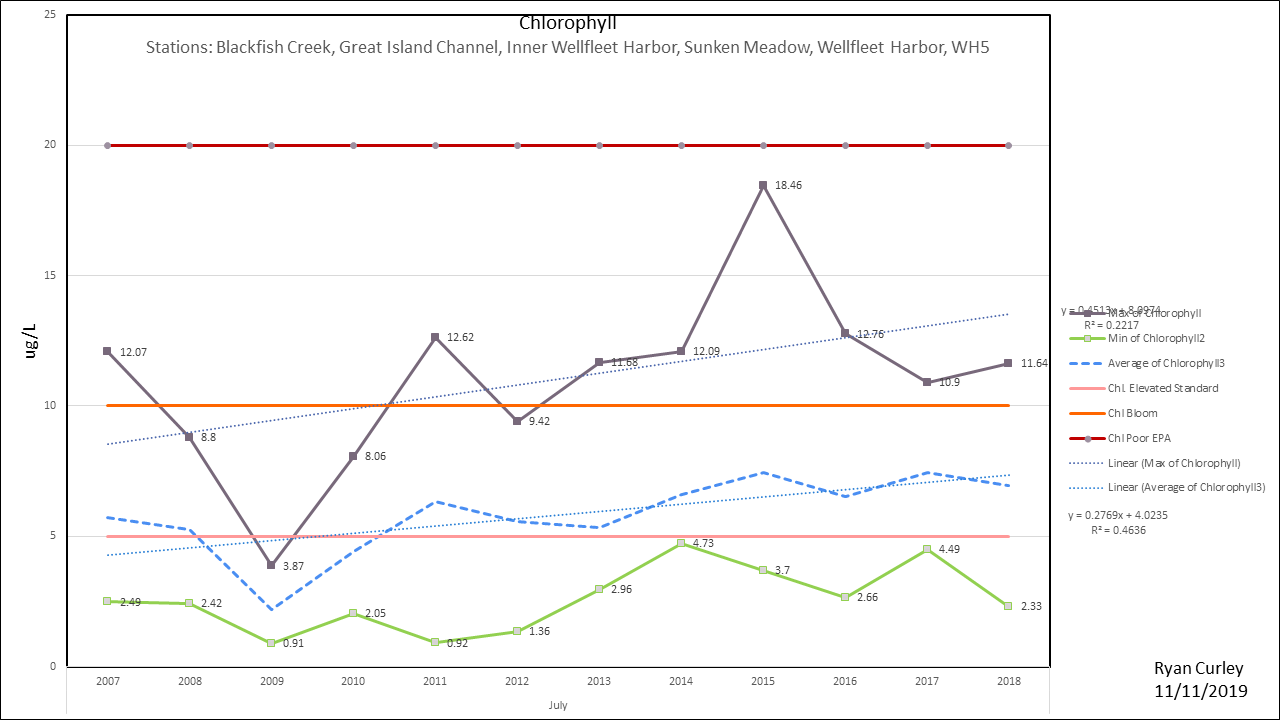
July 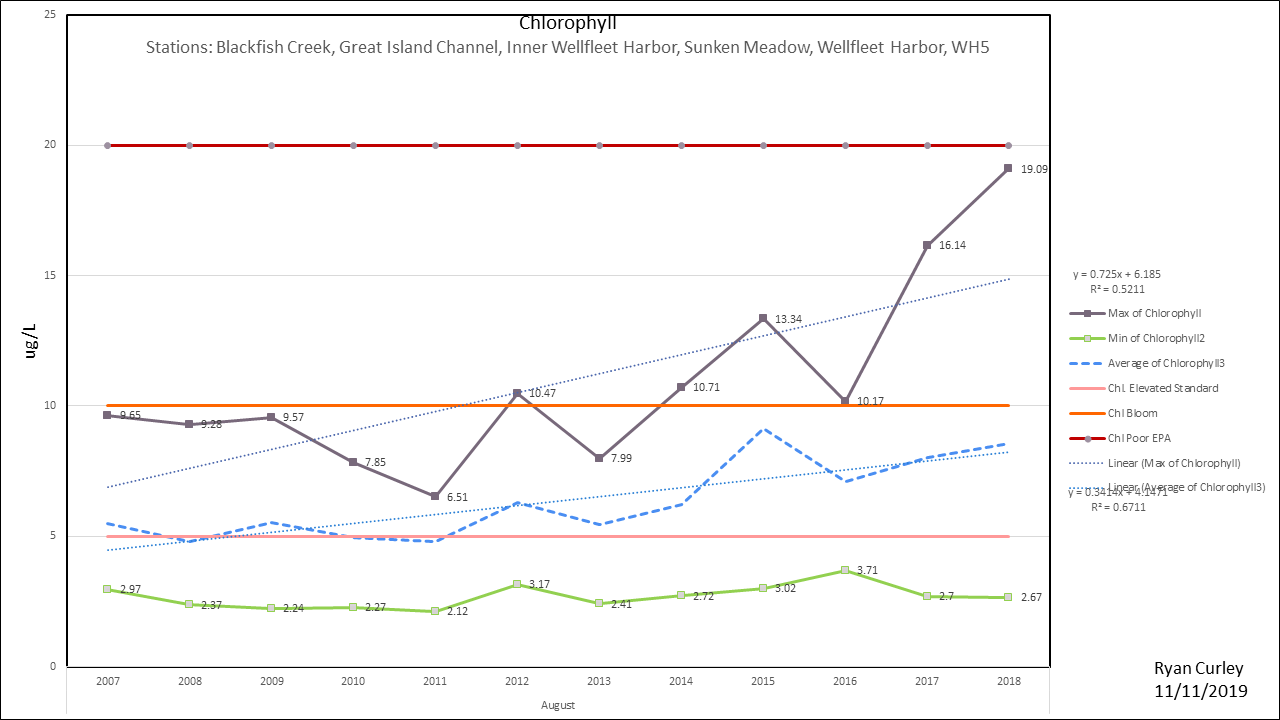
August 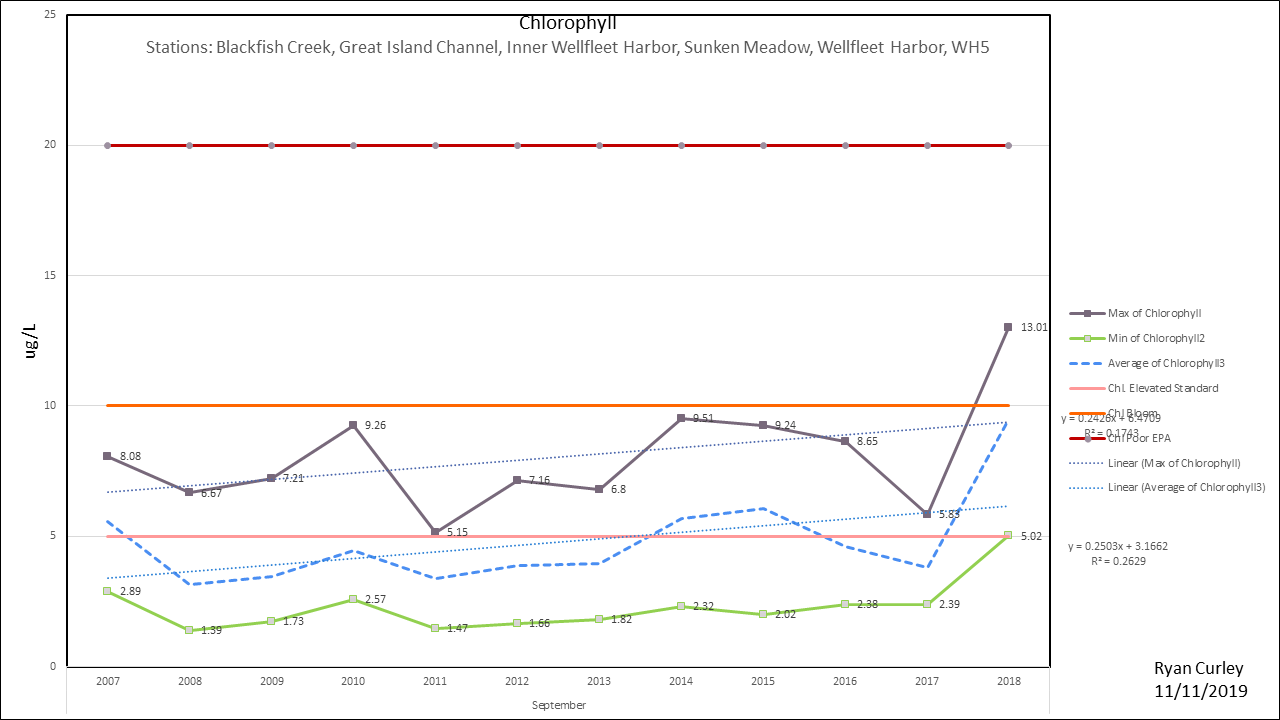
September 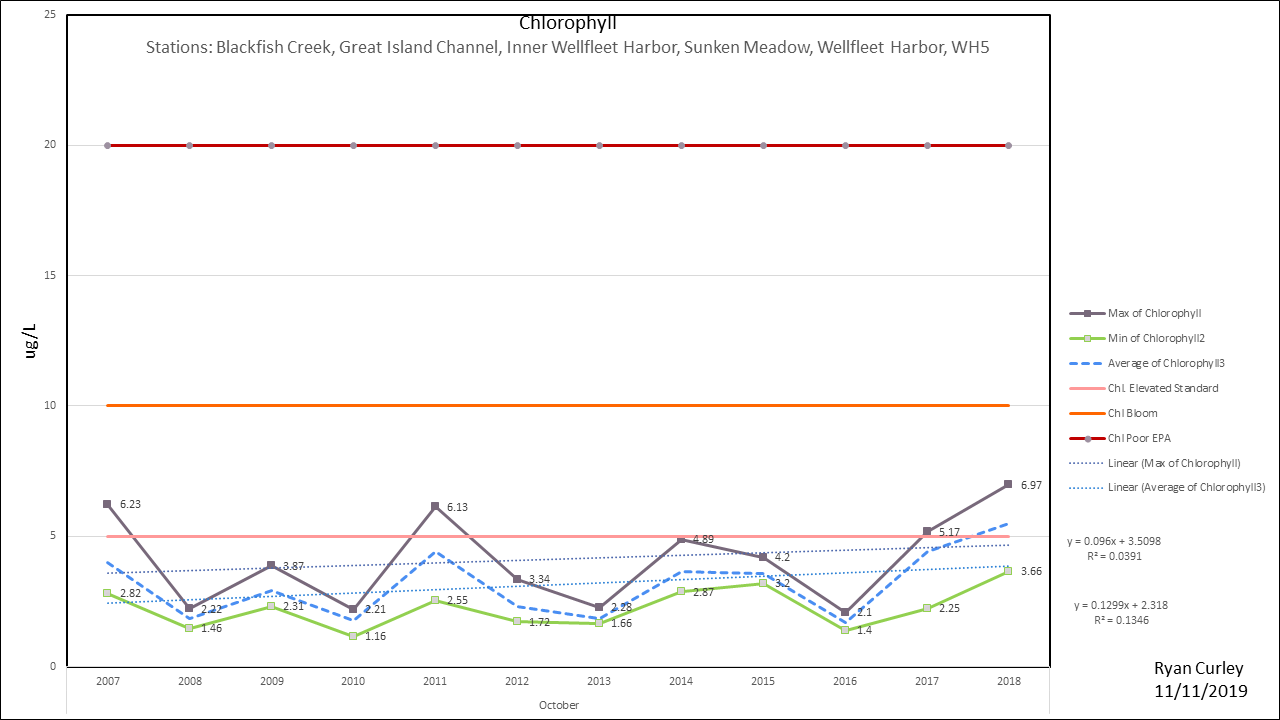
October
Inner Wellfleet Harbor
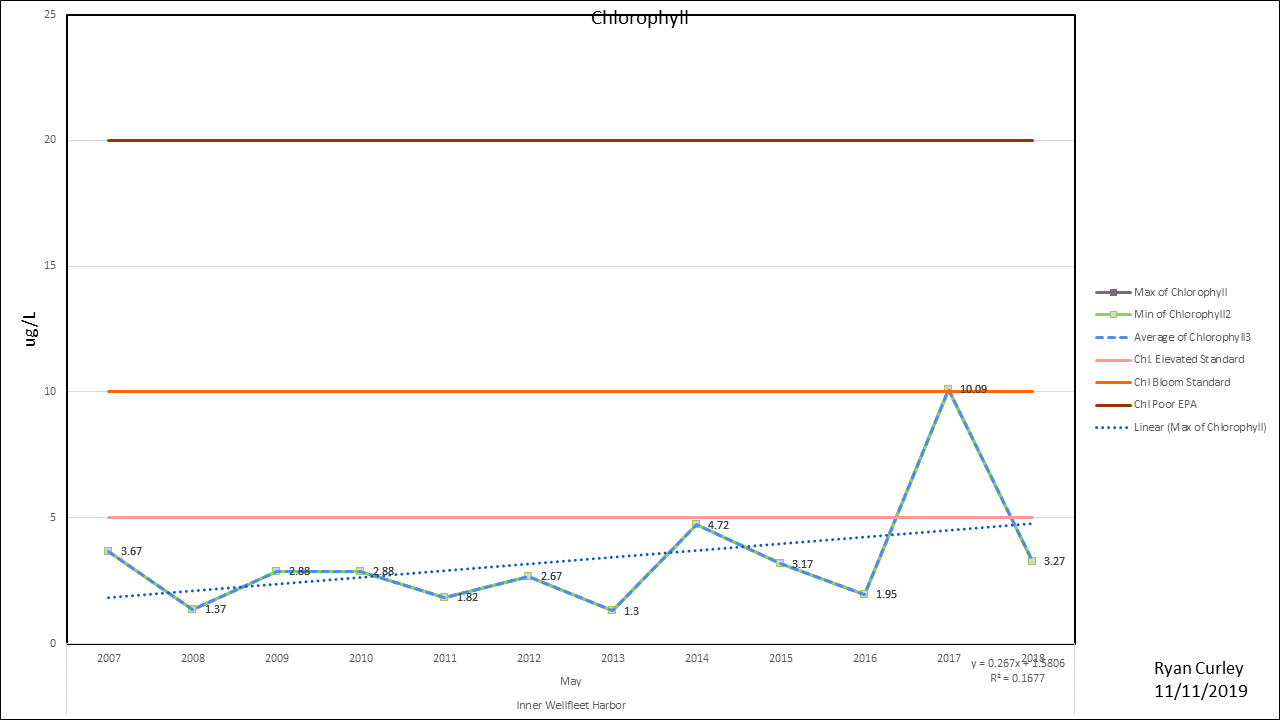
May 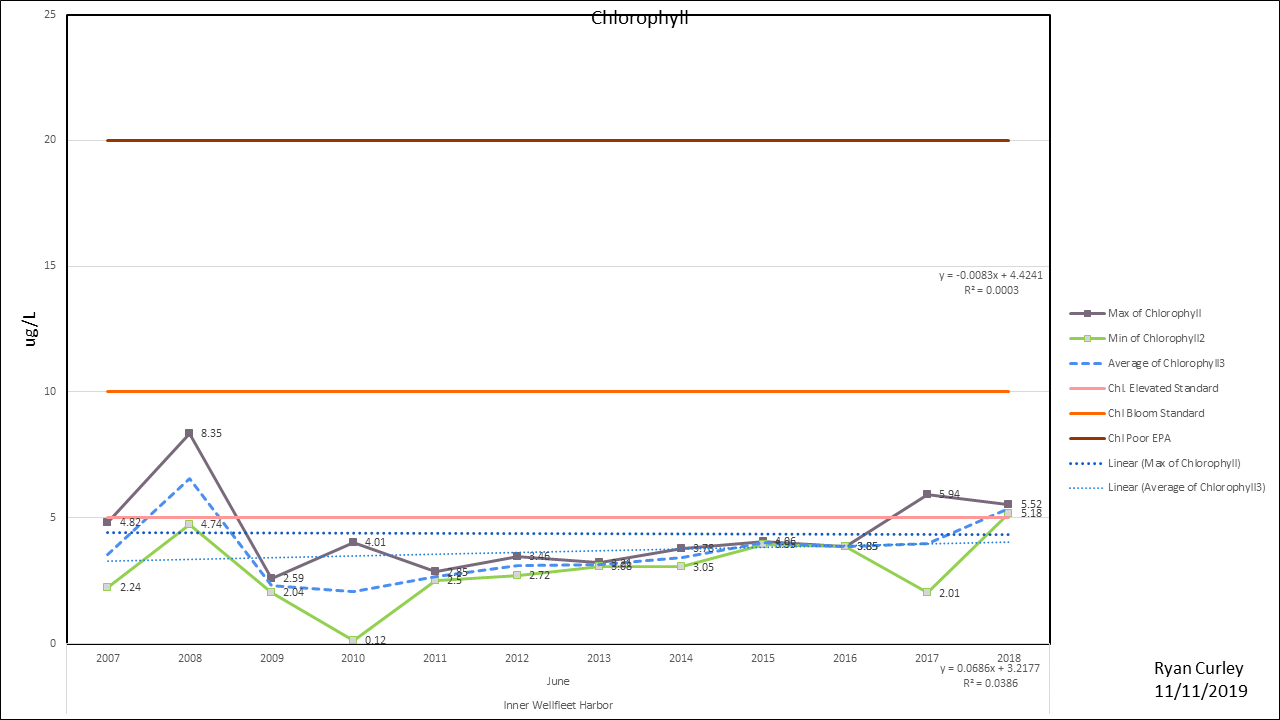
June 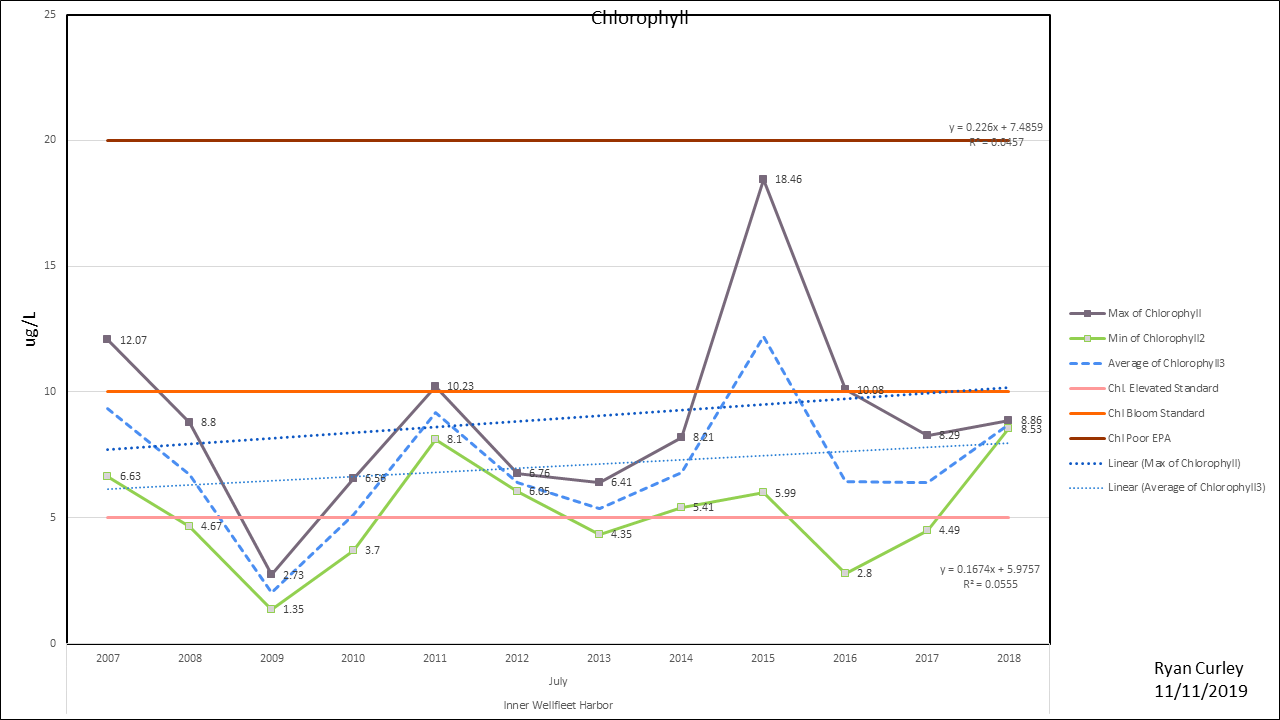
July 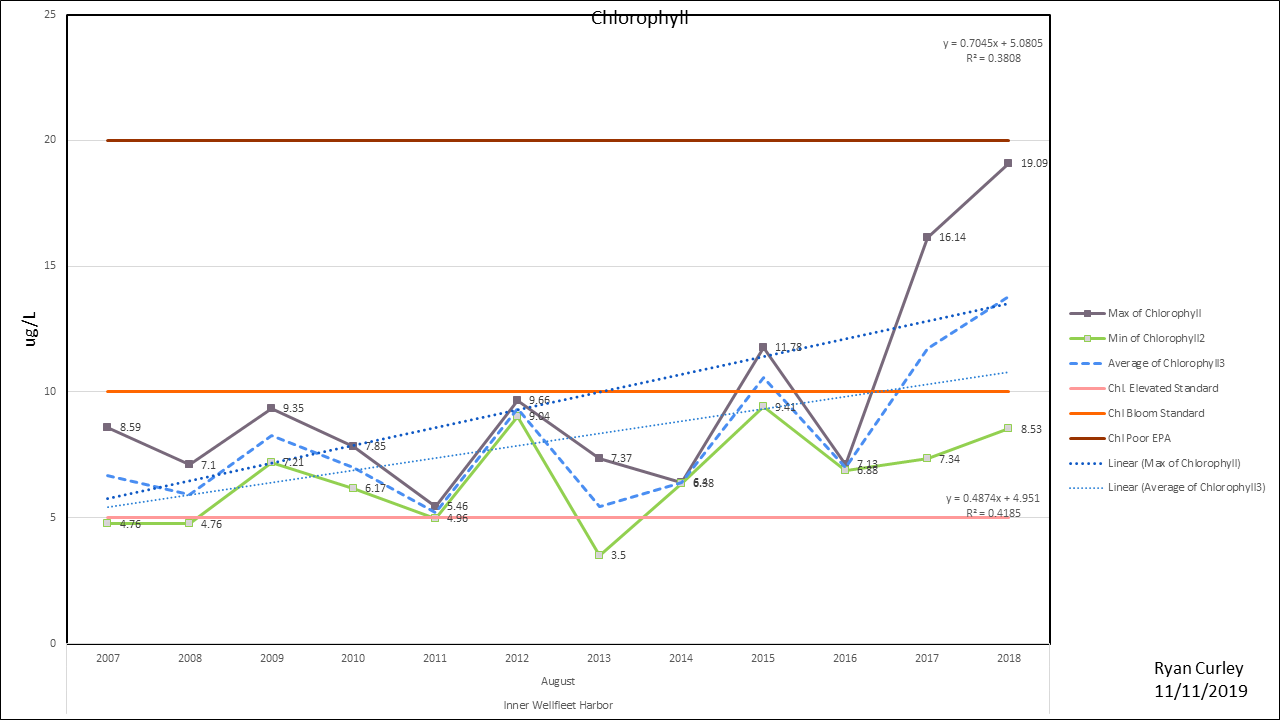
August 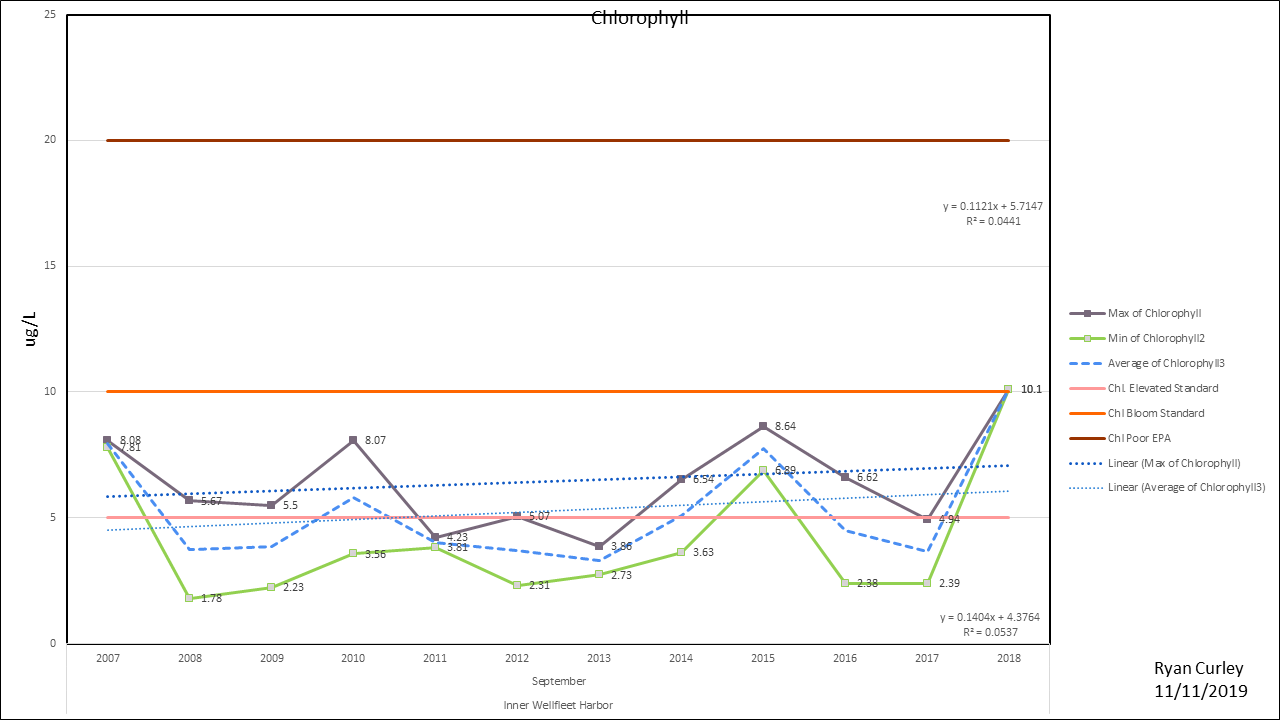
September 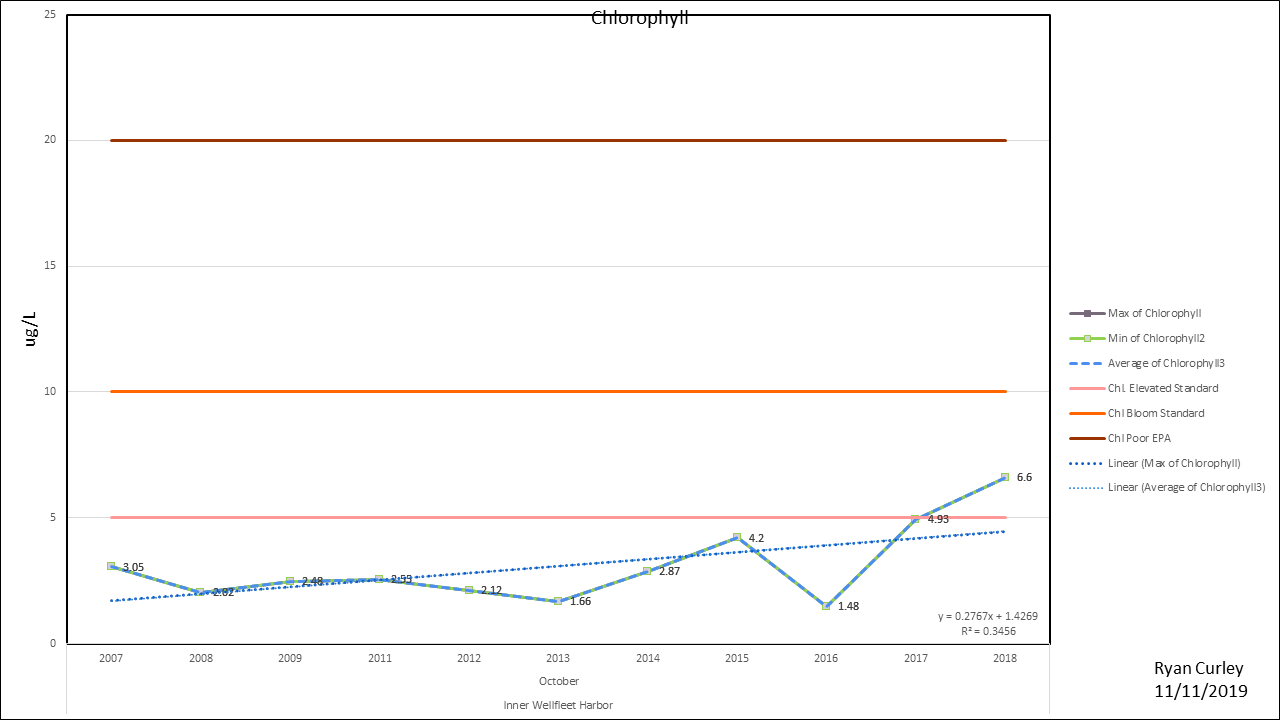
October
Wellfleet Harbor
May 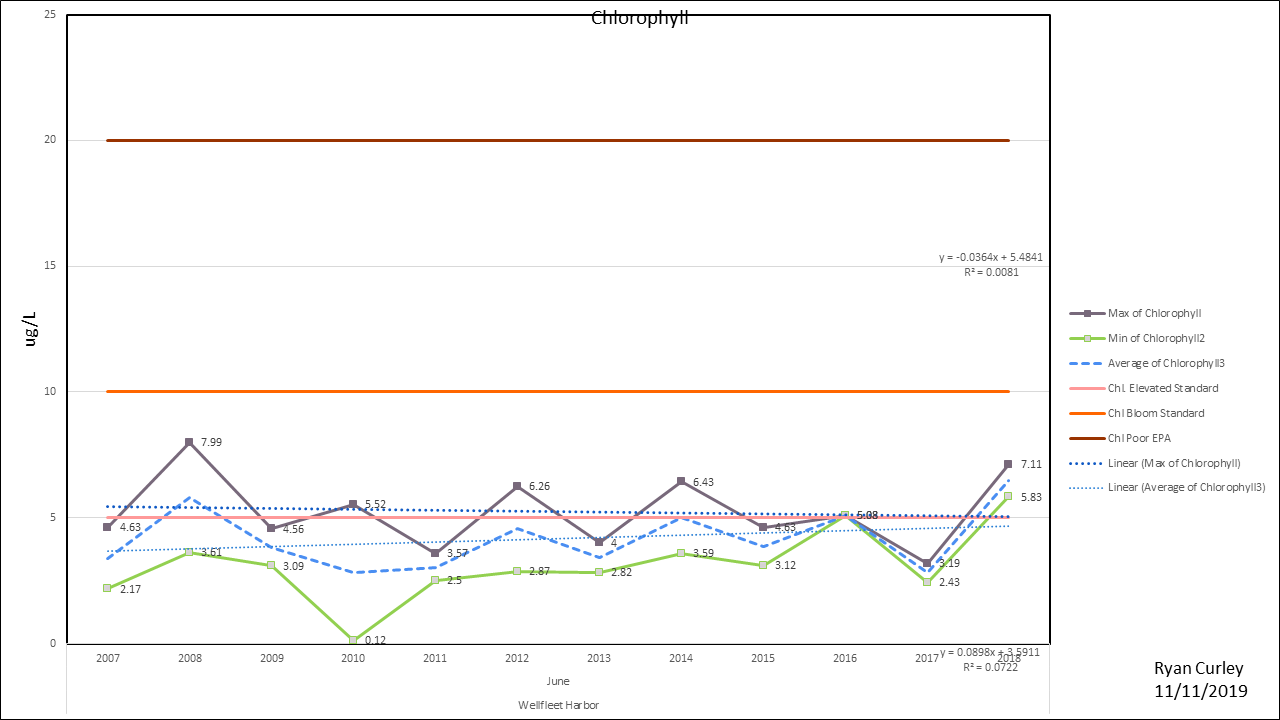
June 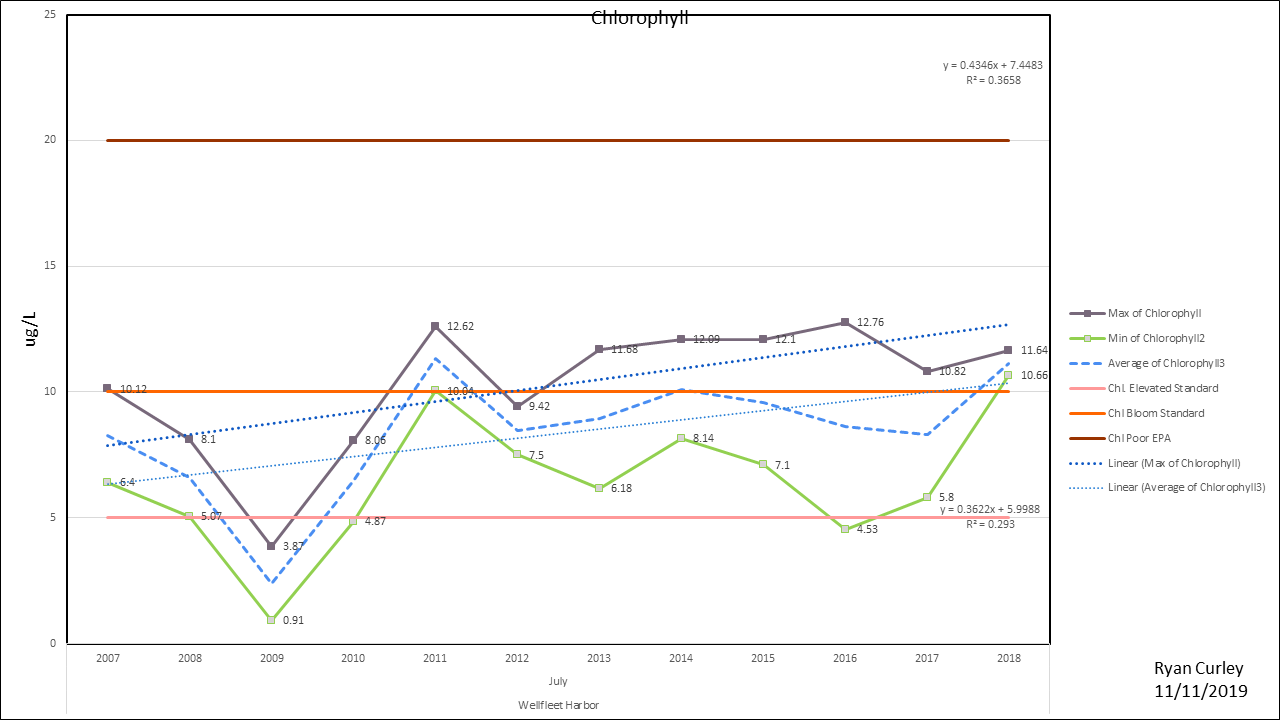
July 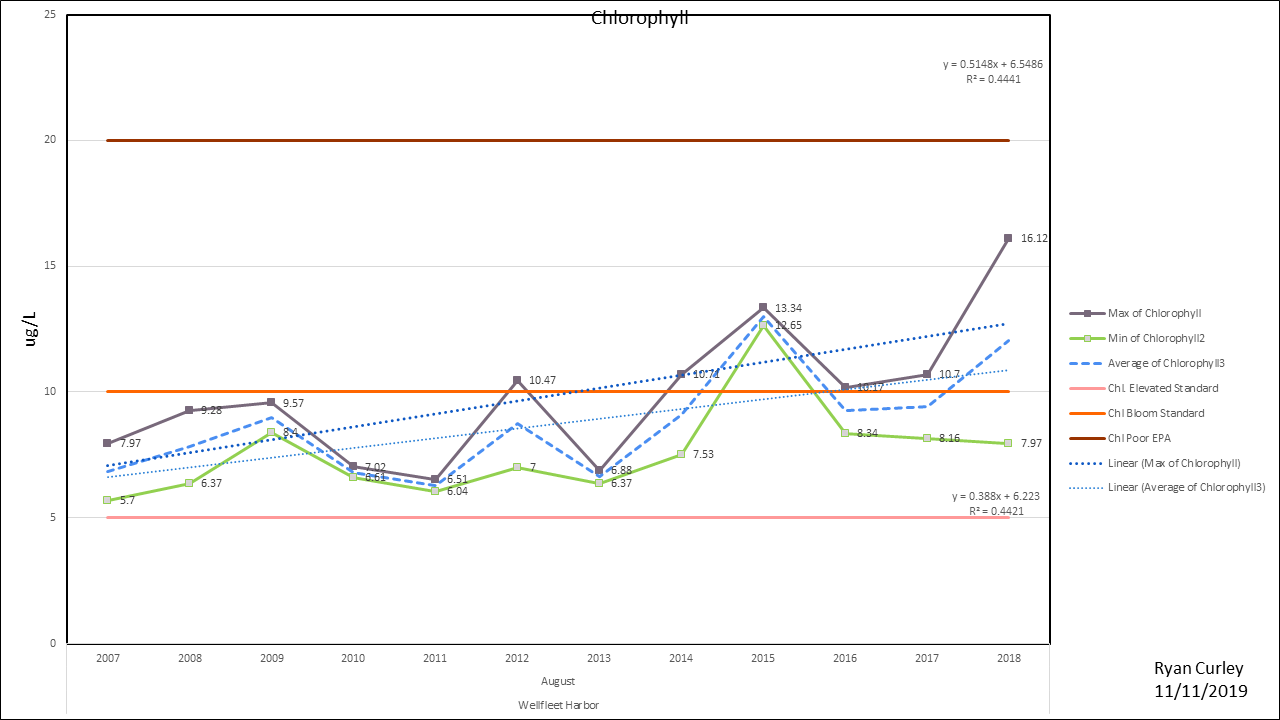
August 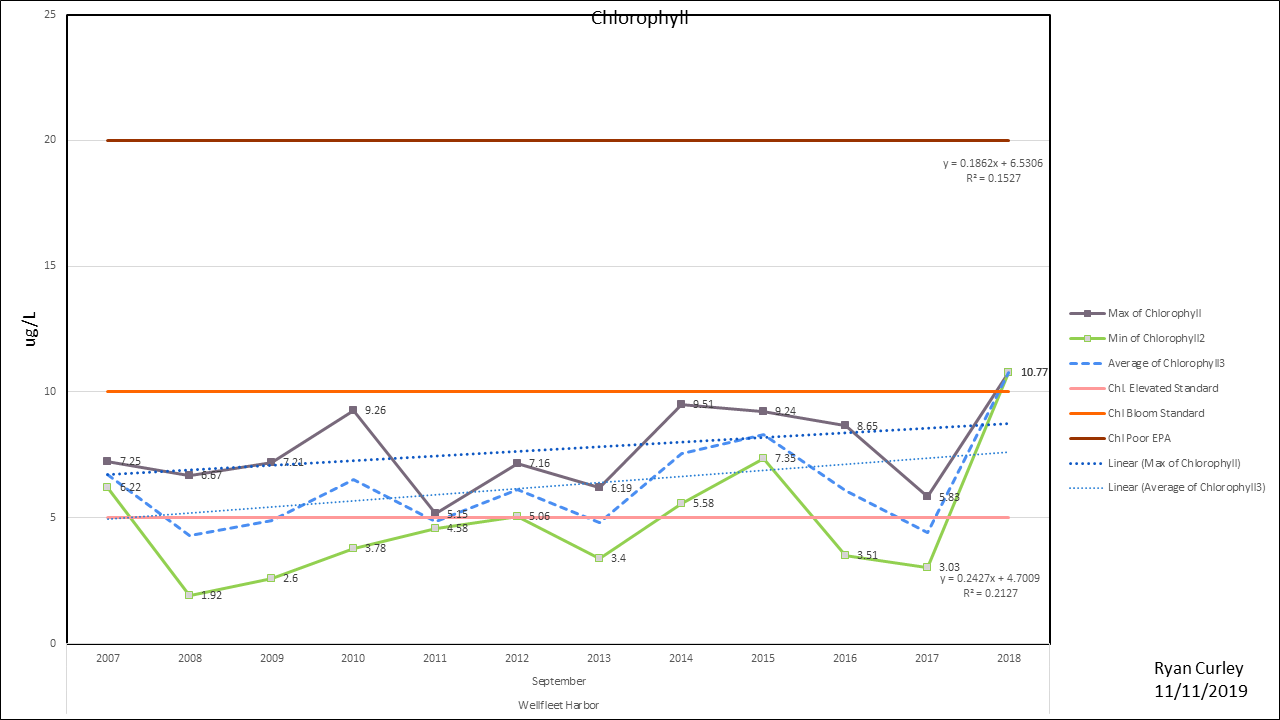
September 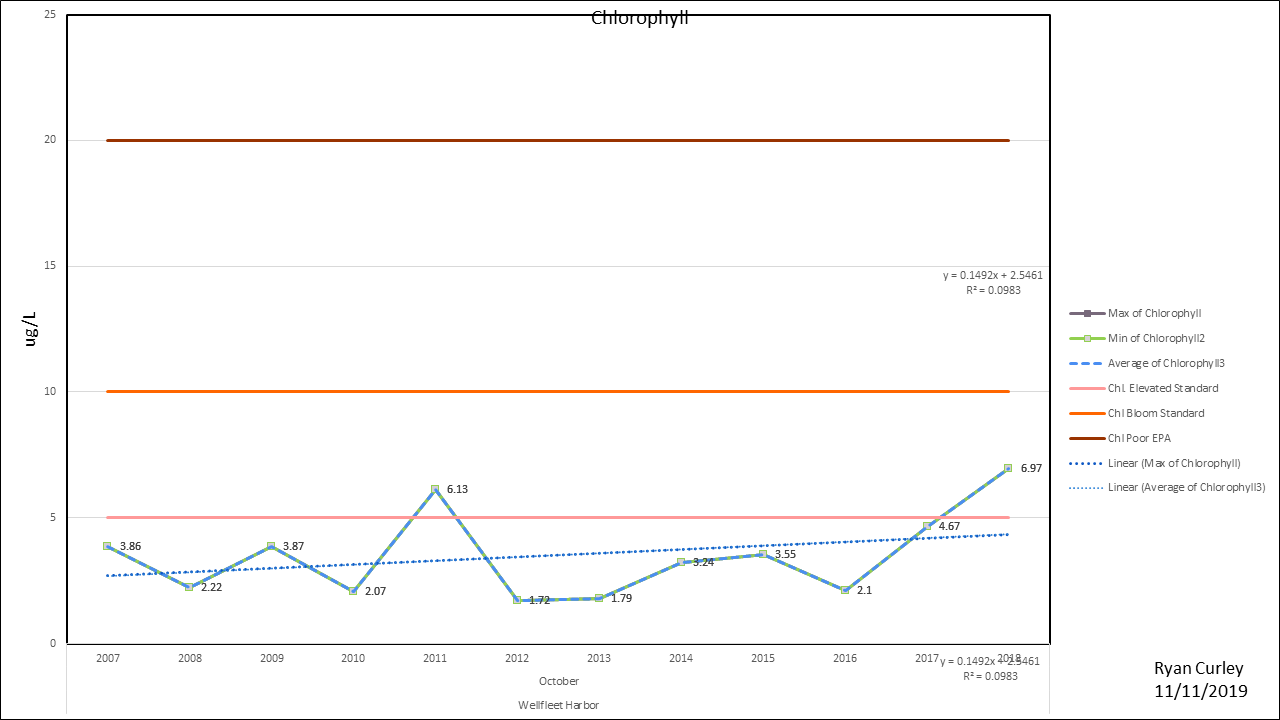
October
Great Island Channel
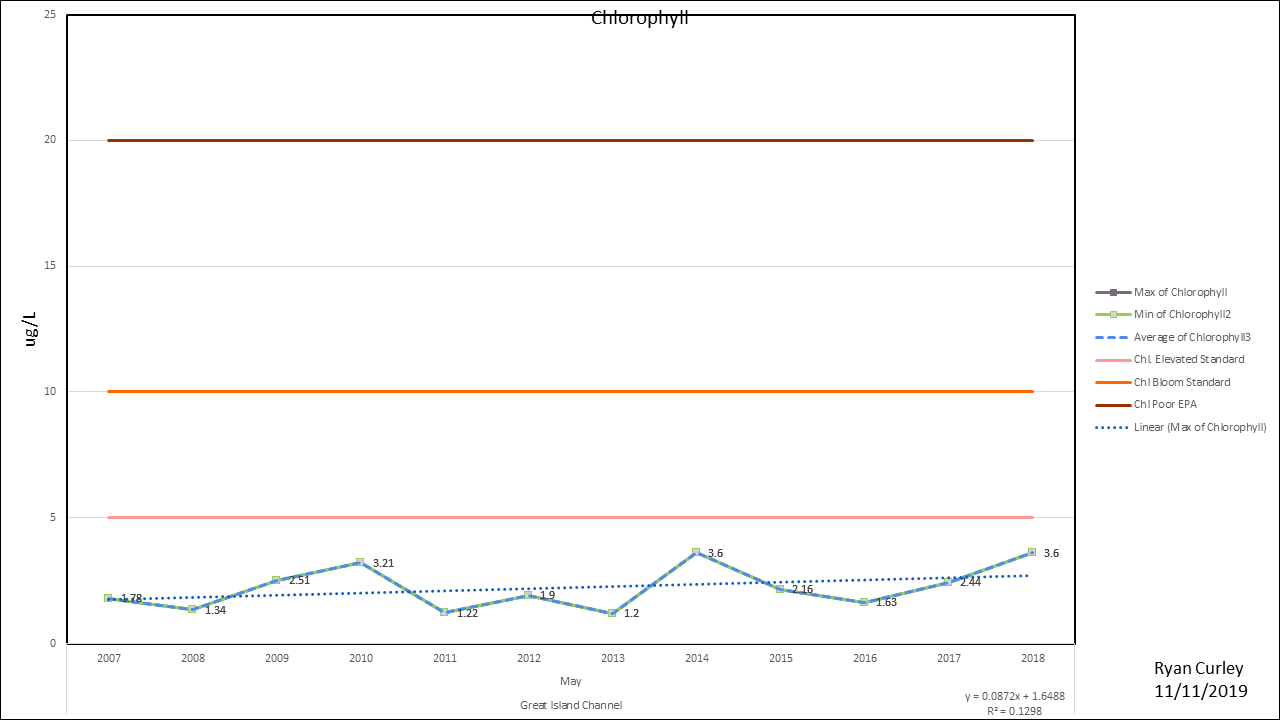
May 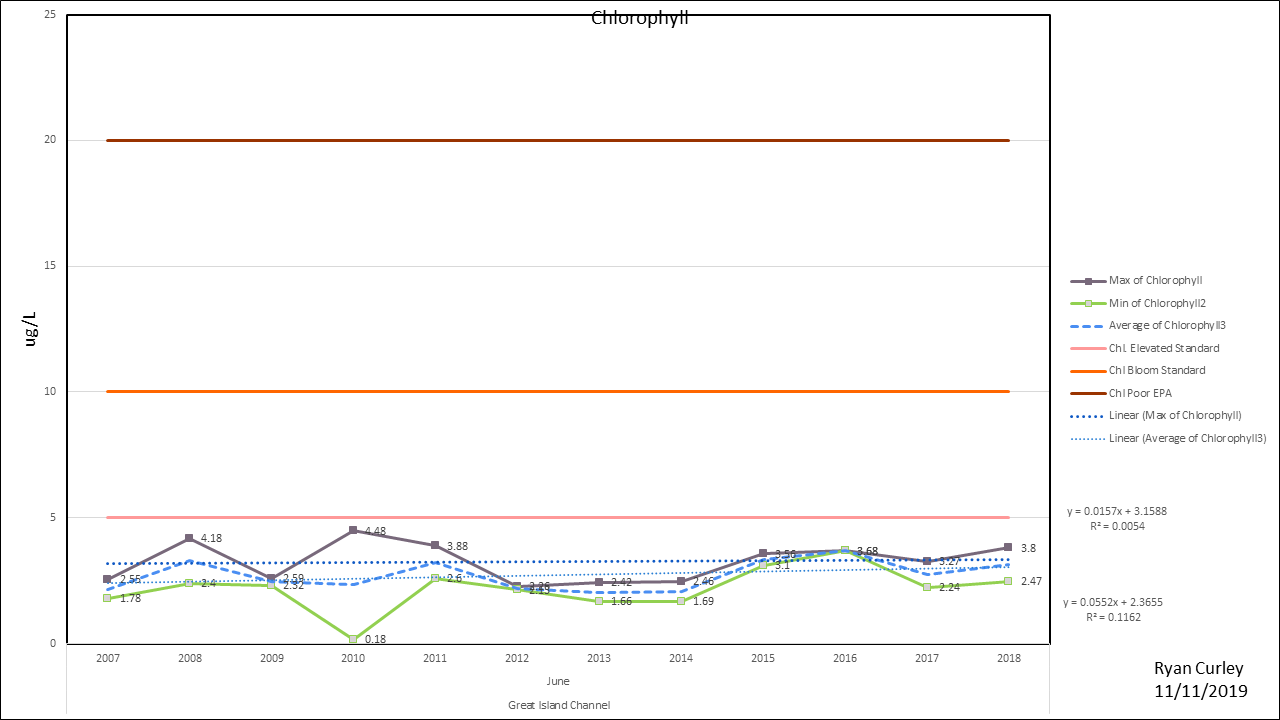
June 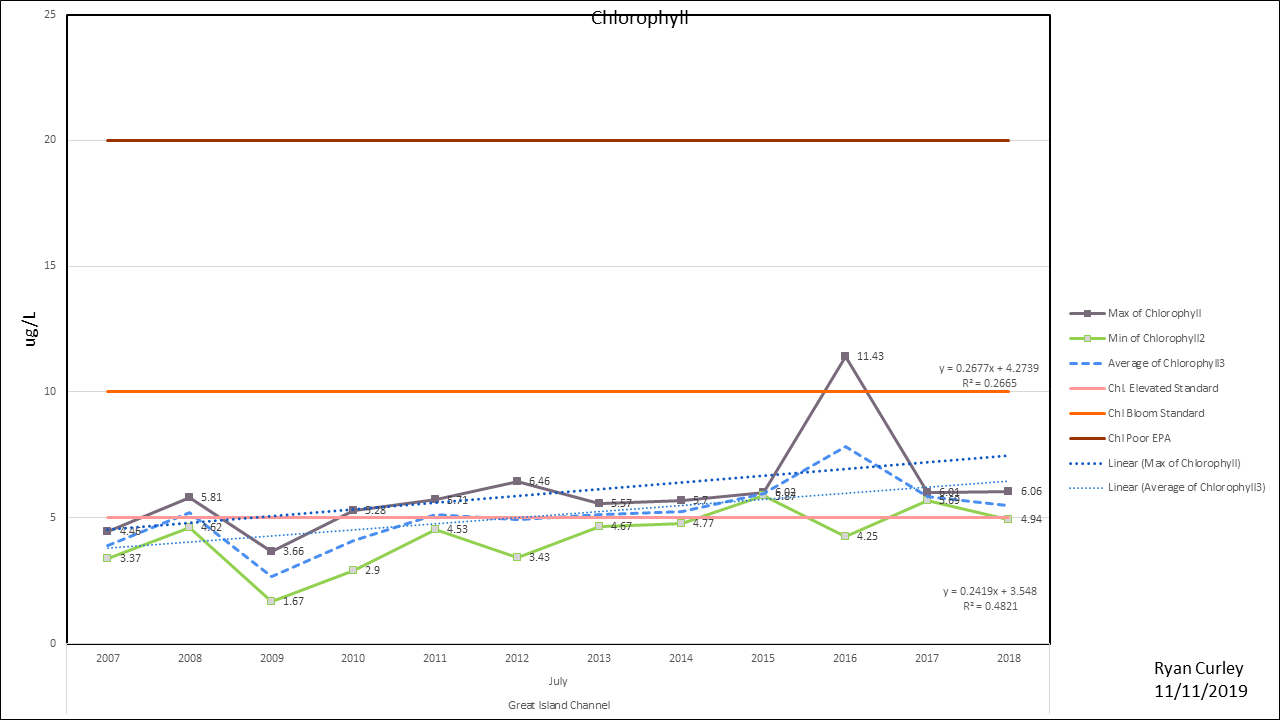
July 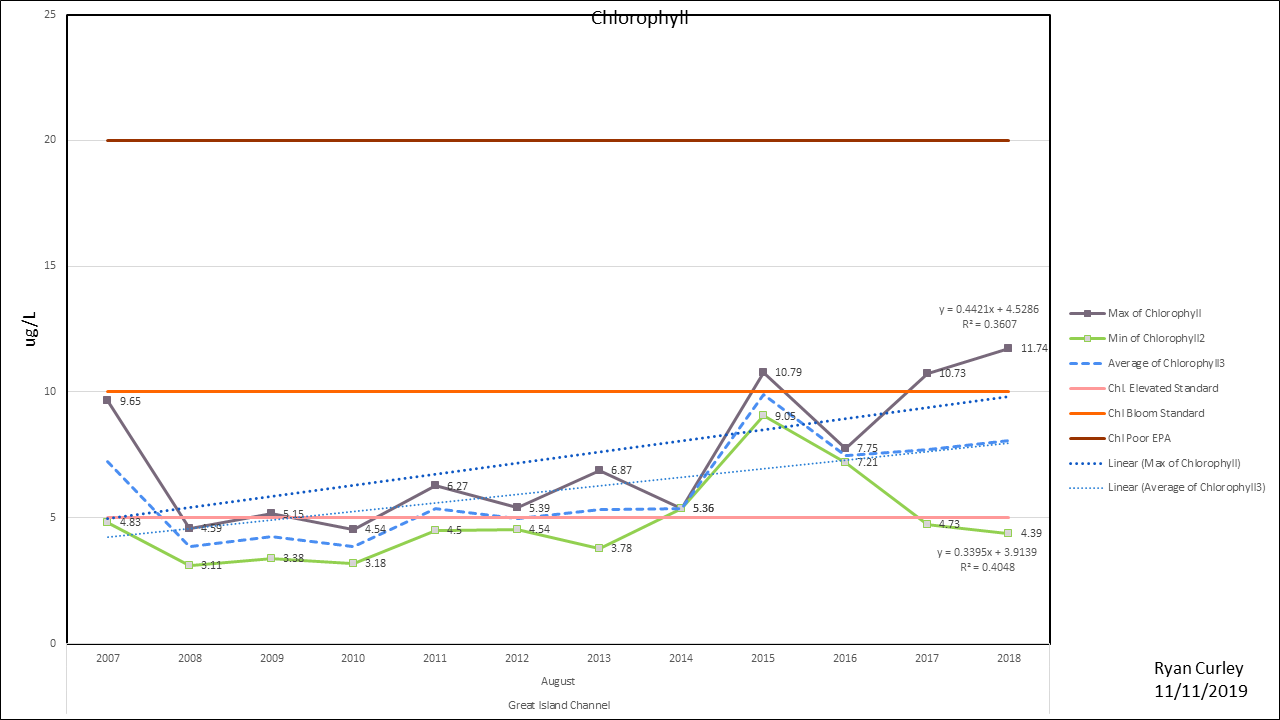
August 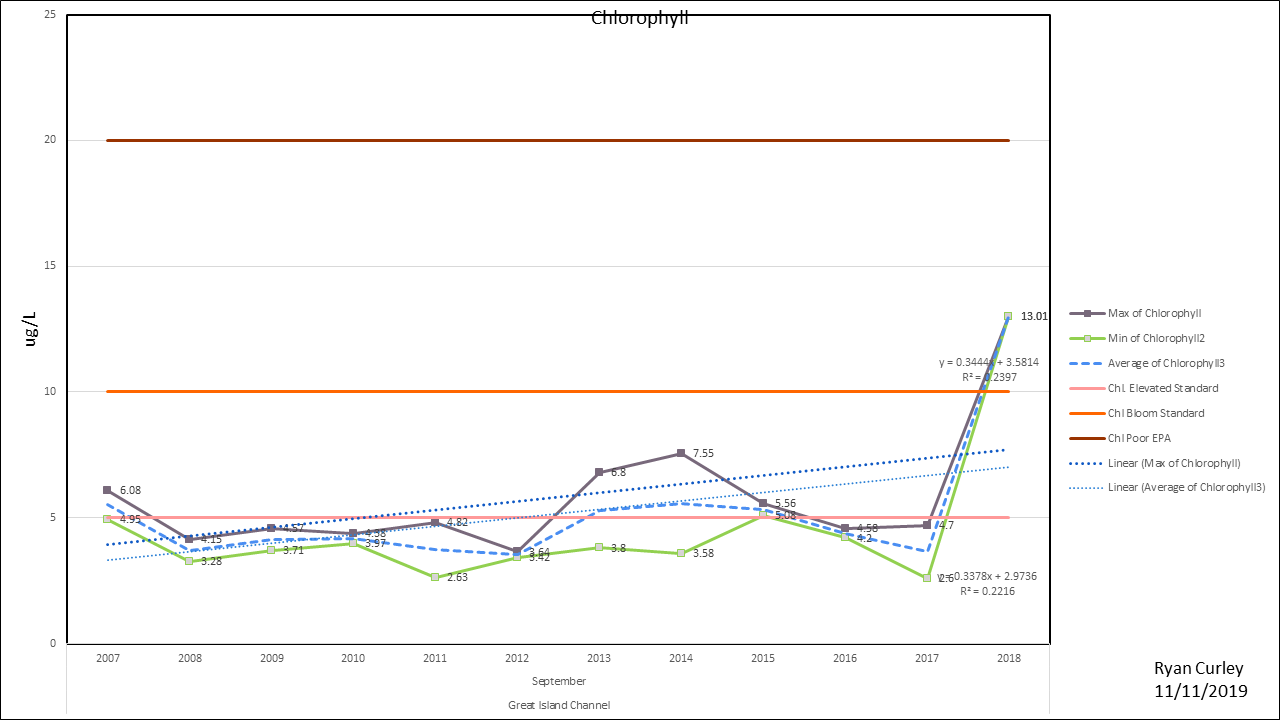
September 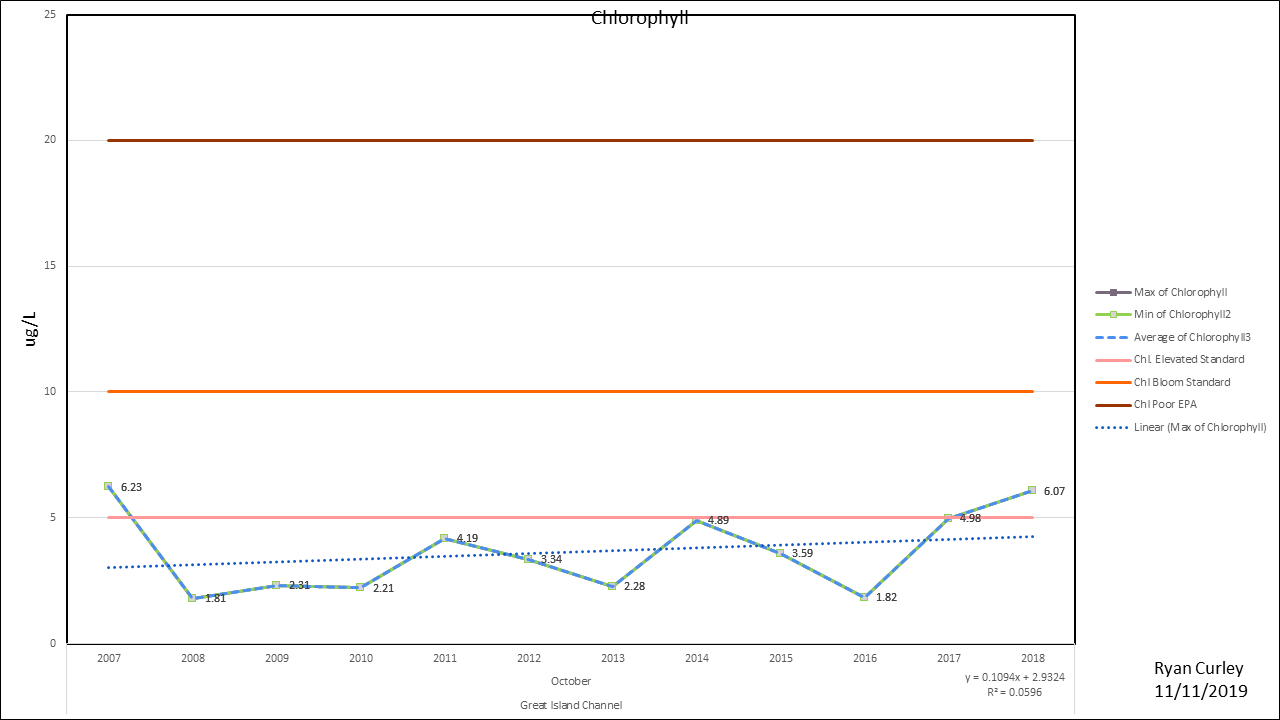
October
Blackfish Creek

May 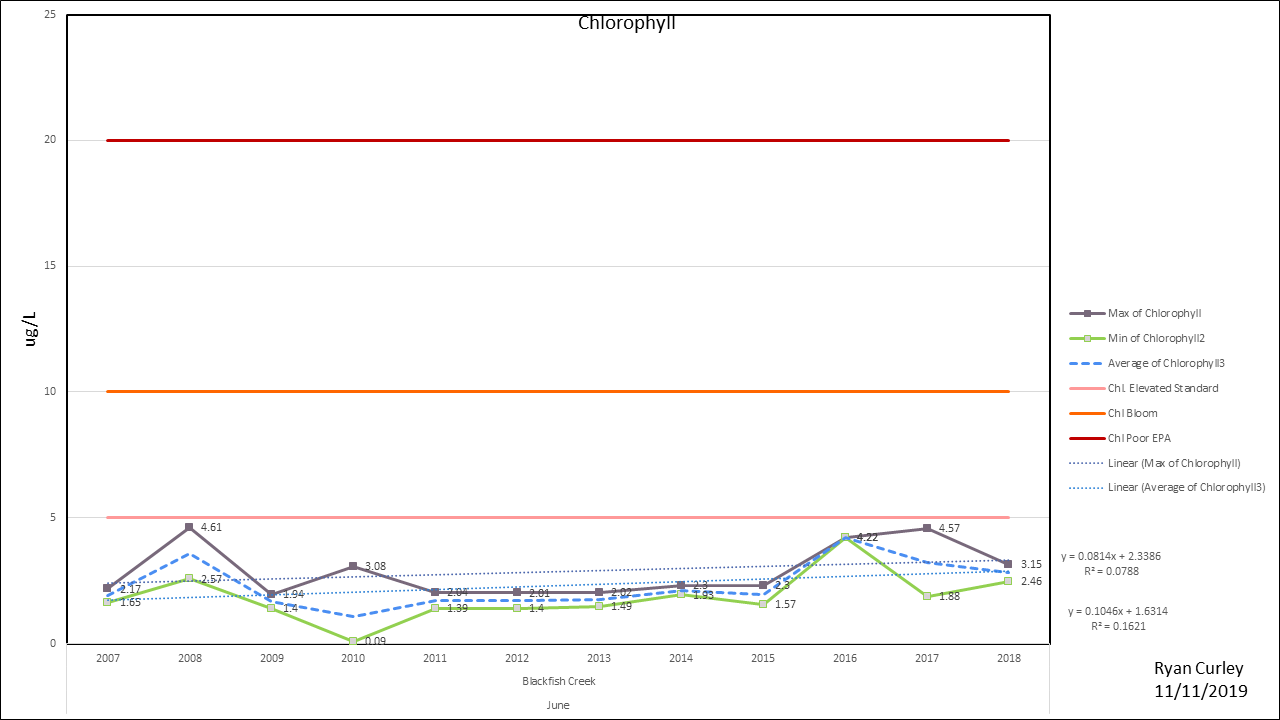
June 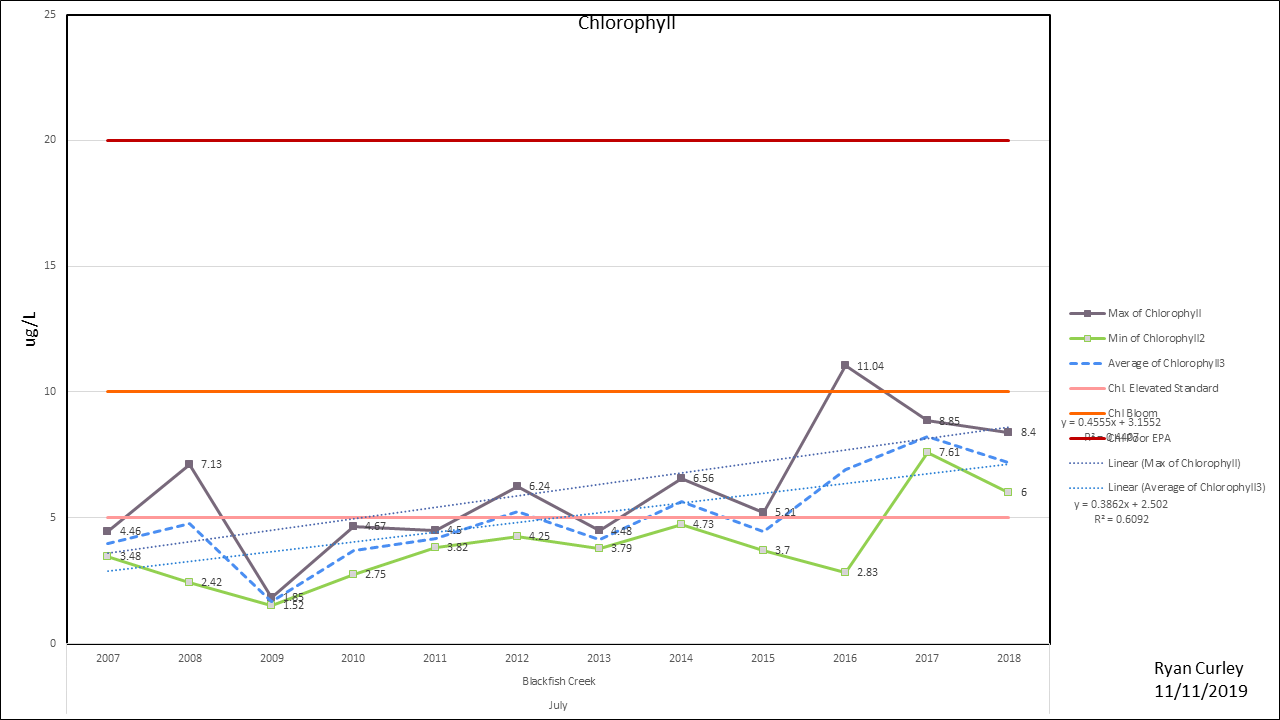
July 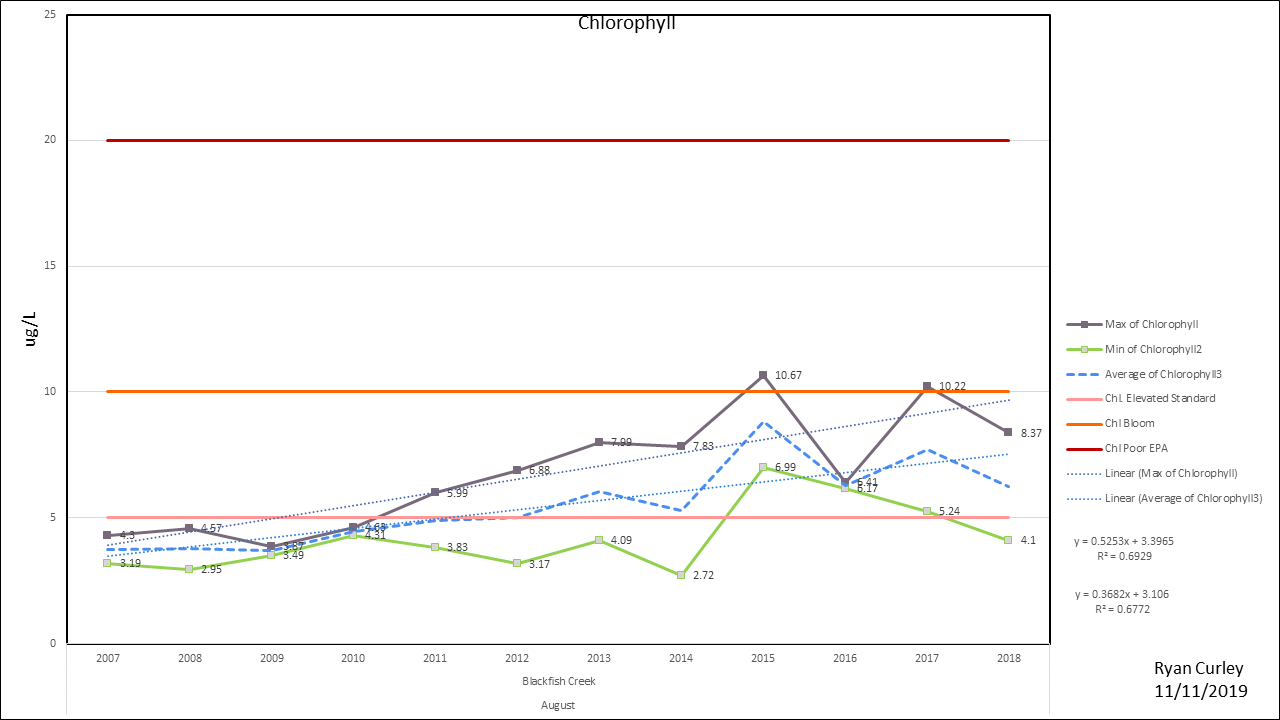
August 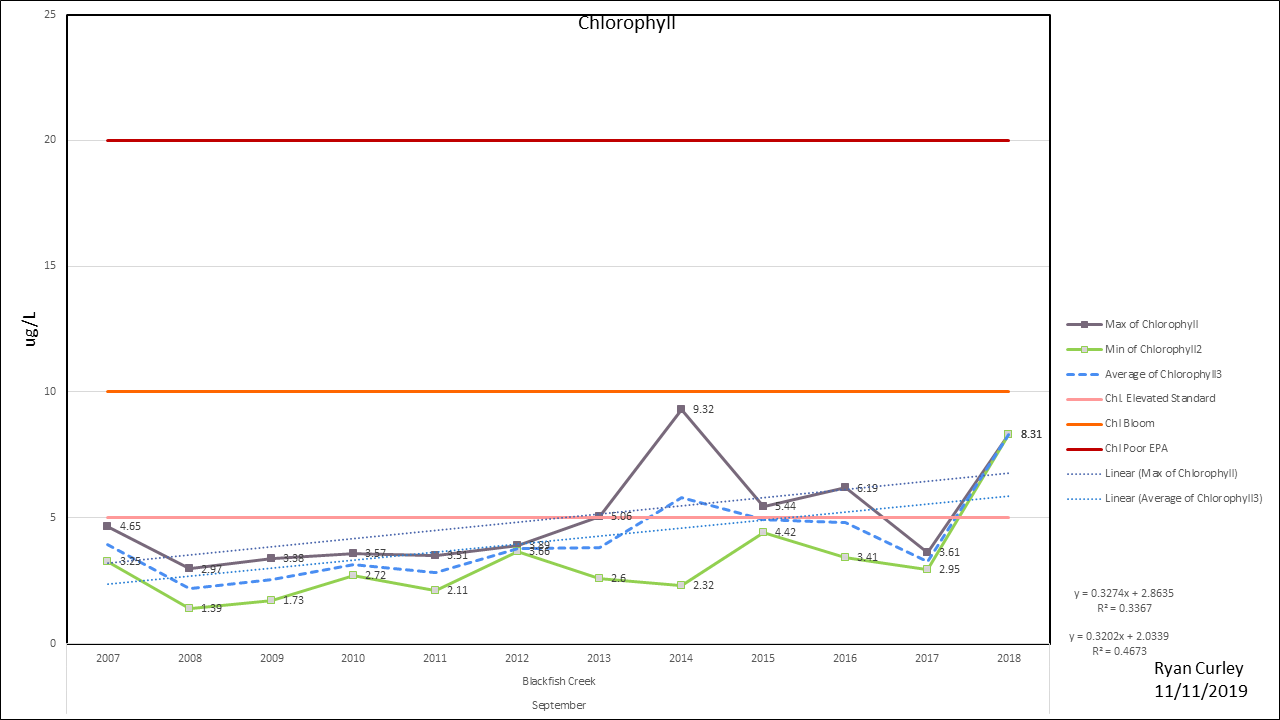
September 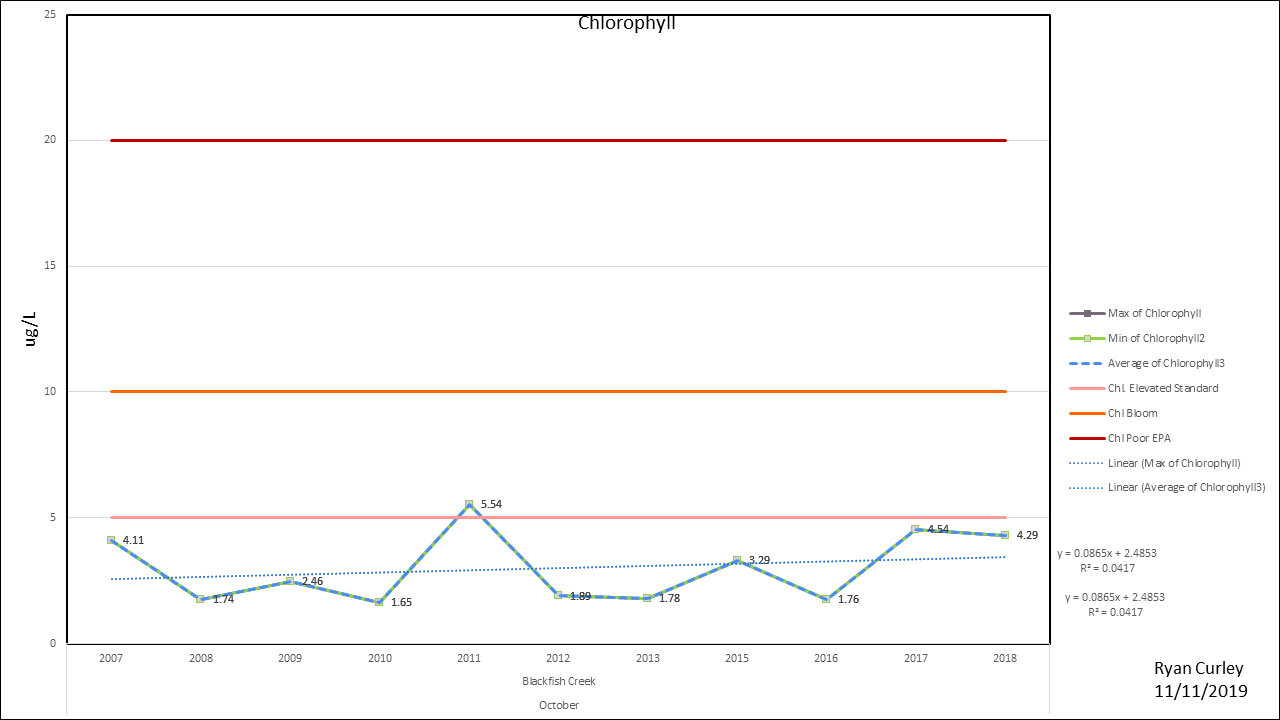
October
Sunken Meadow/ South Lt. Island
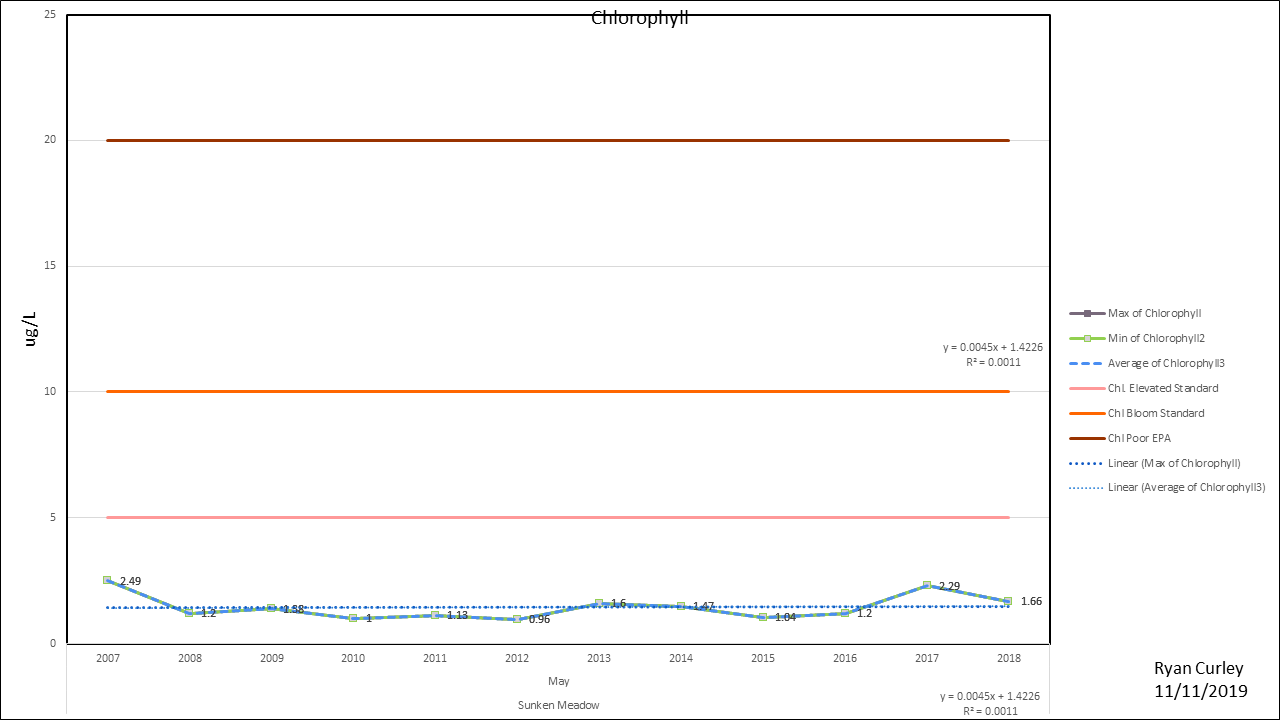
May 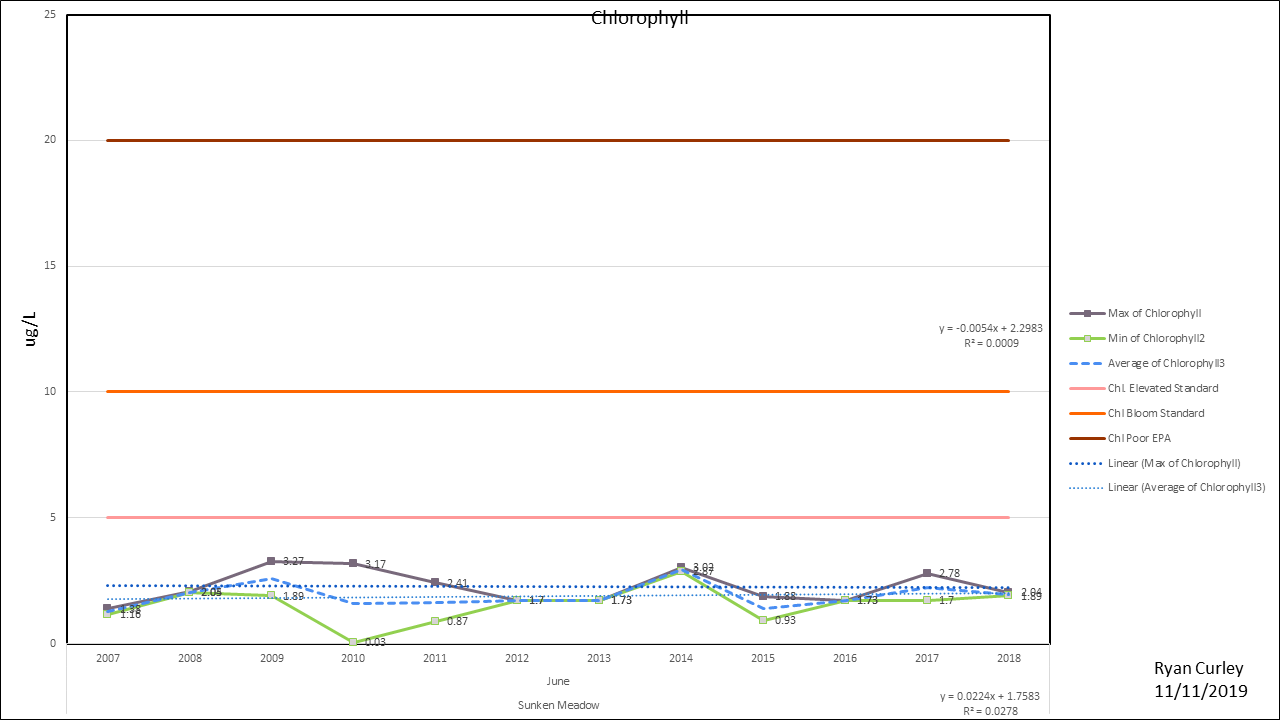
June 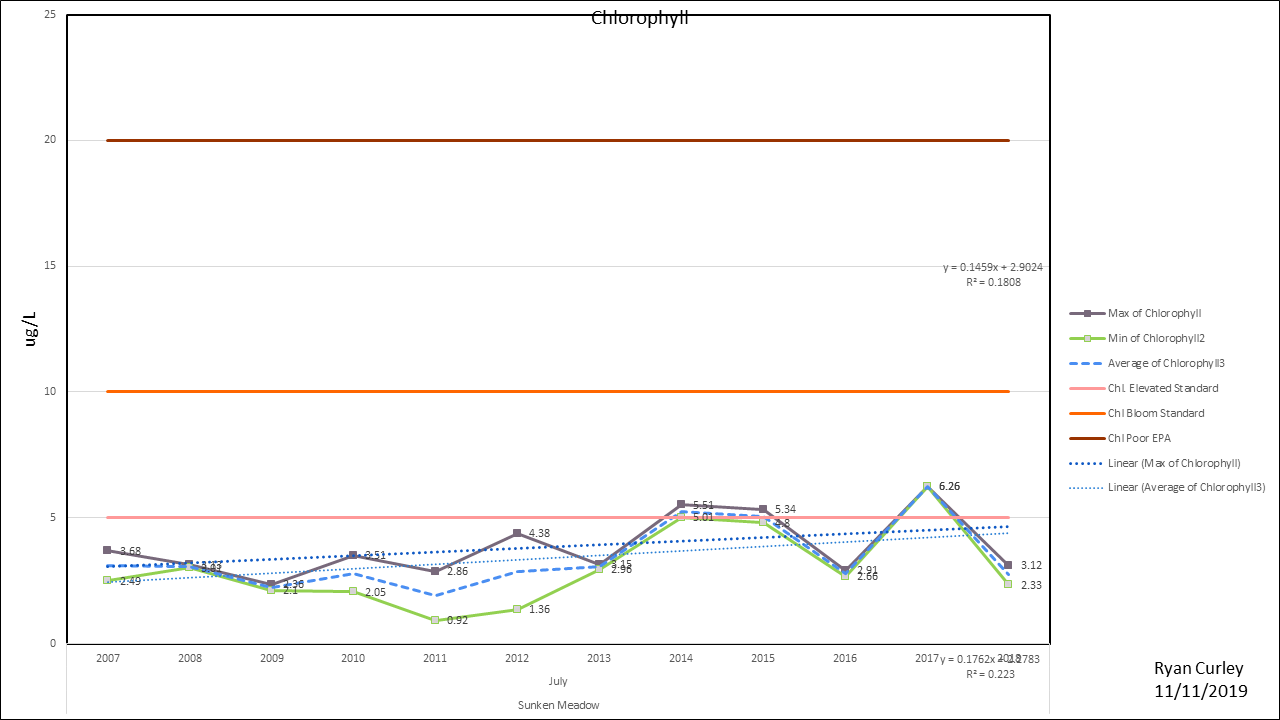
July 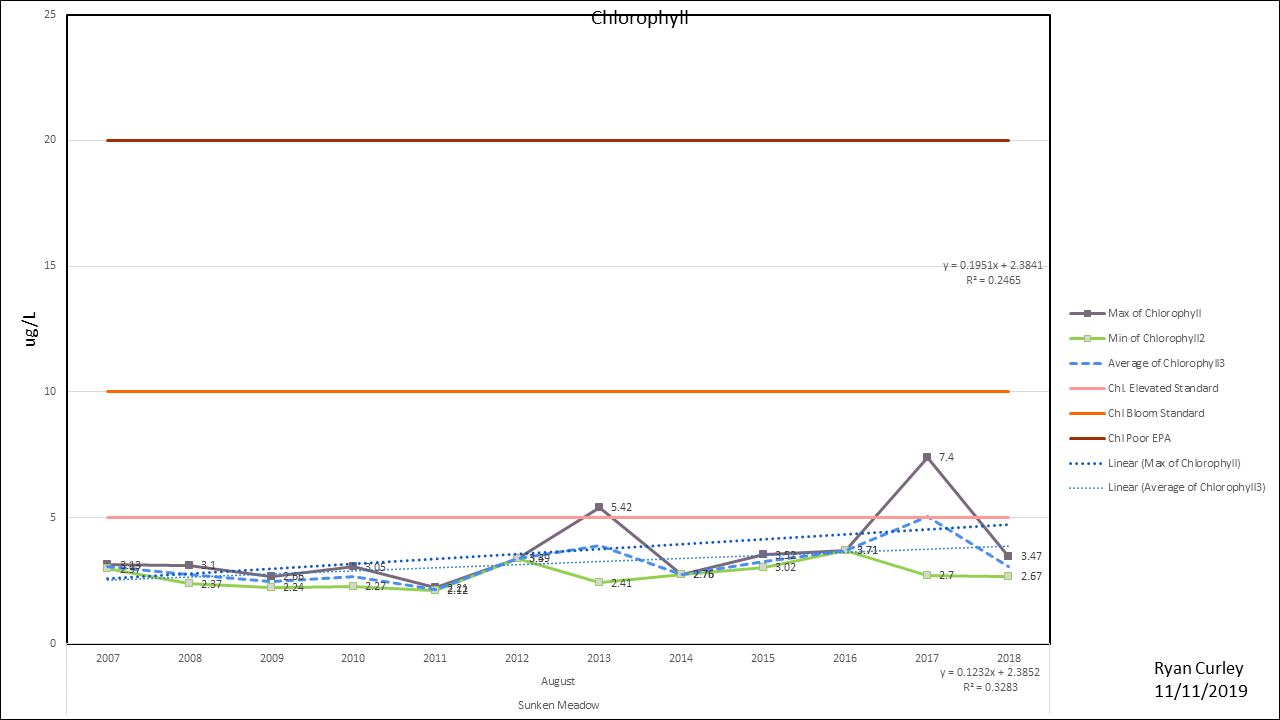
August 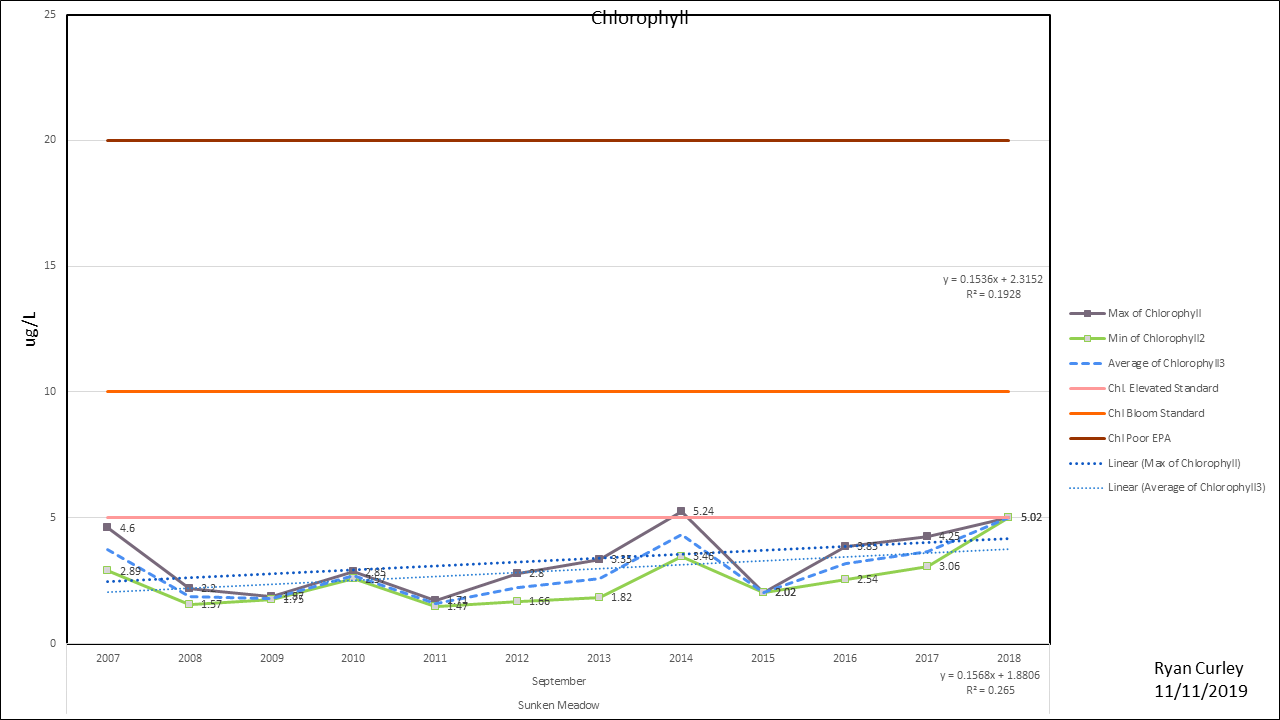
September 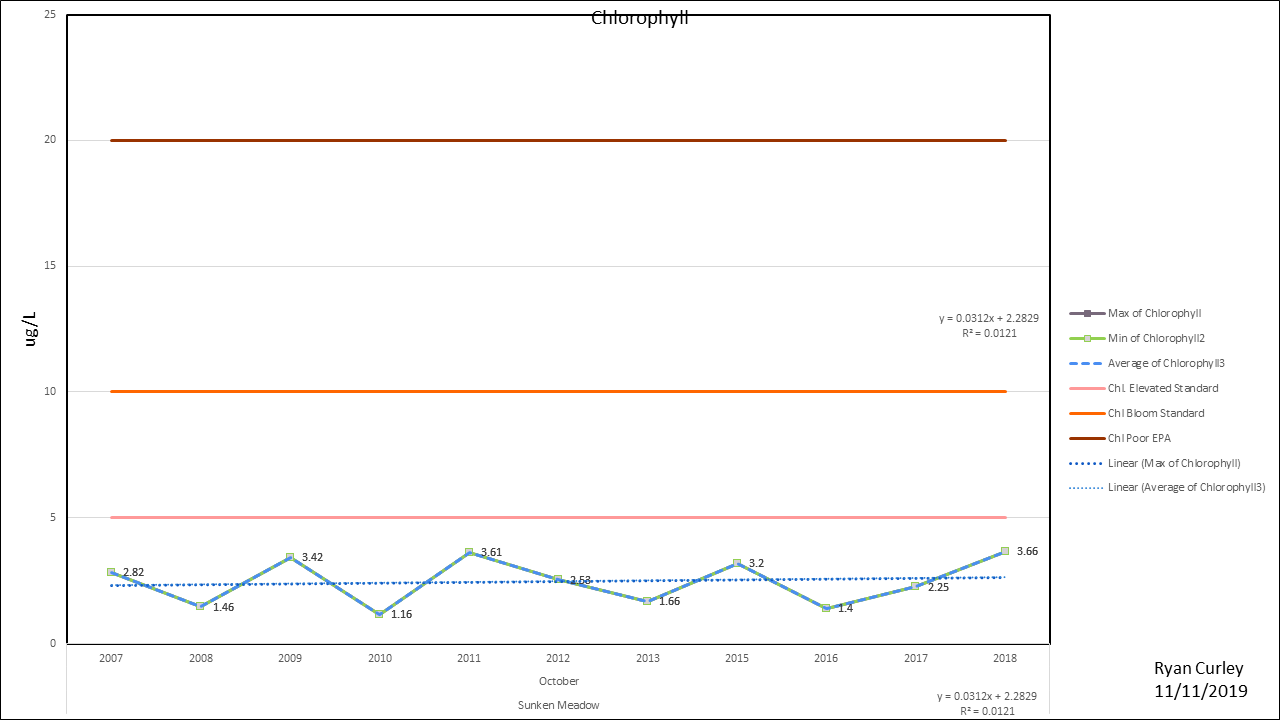
October
Herring River

May 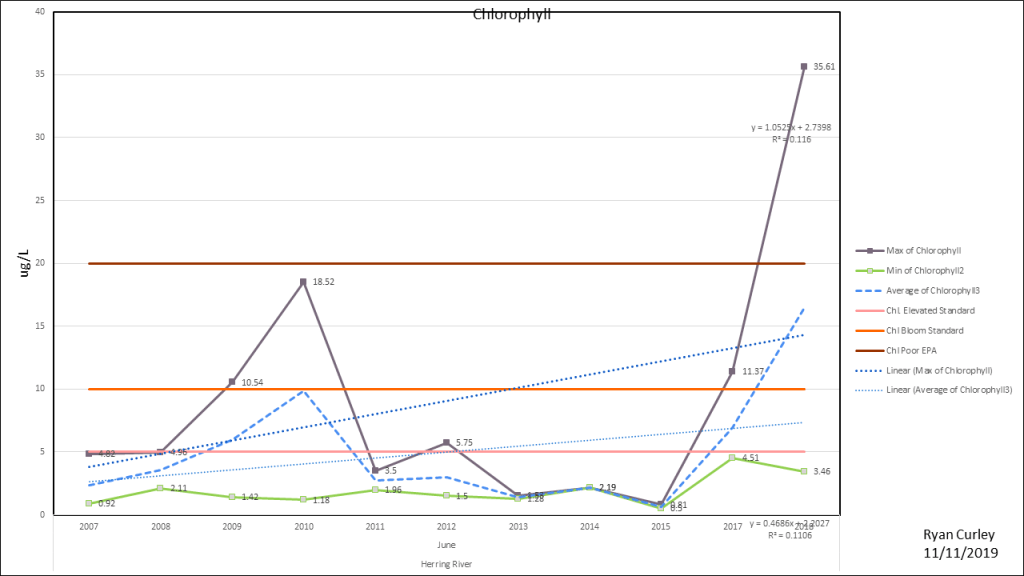
June 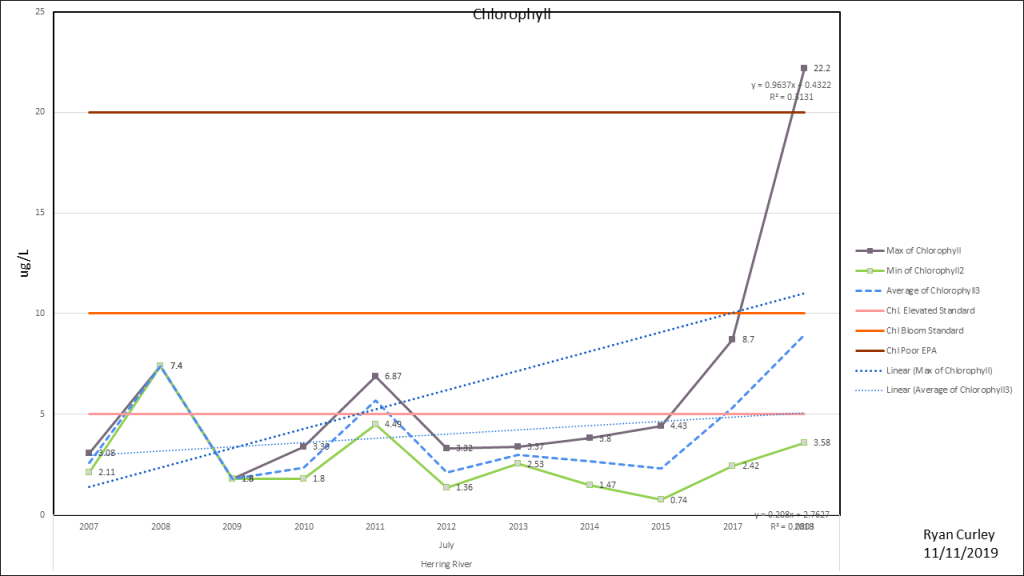
July 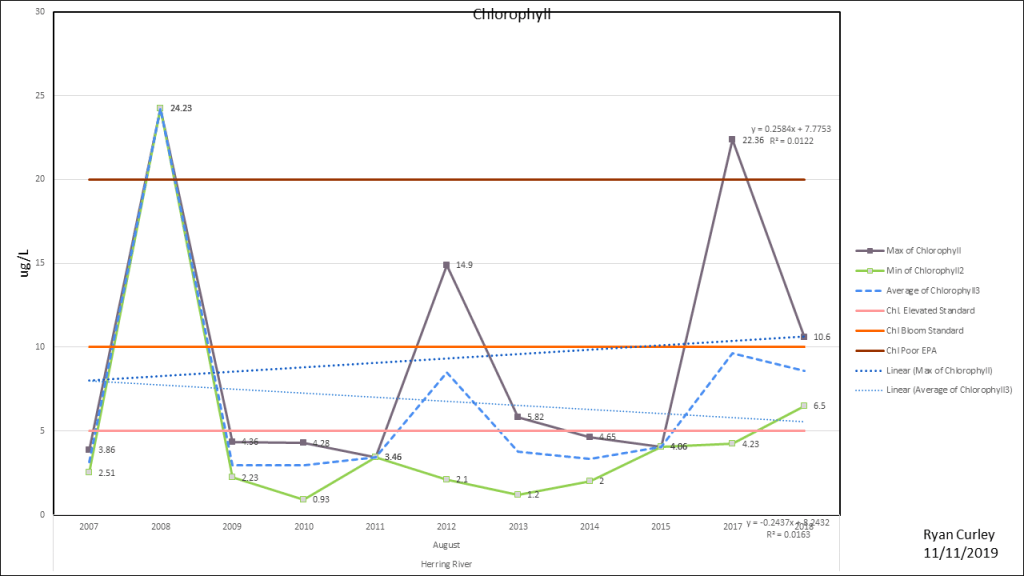
August 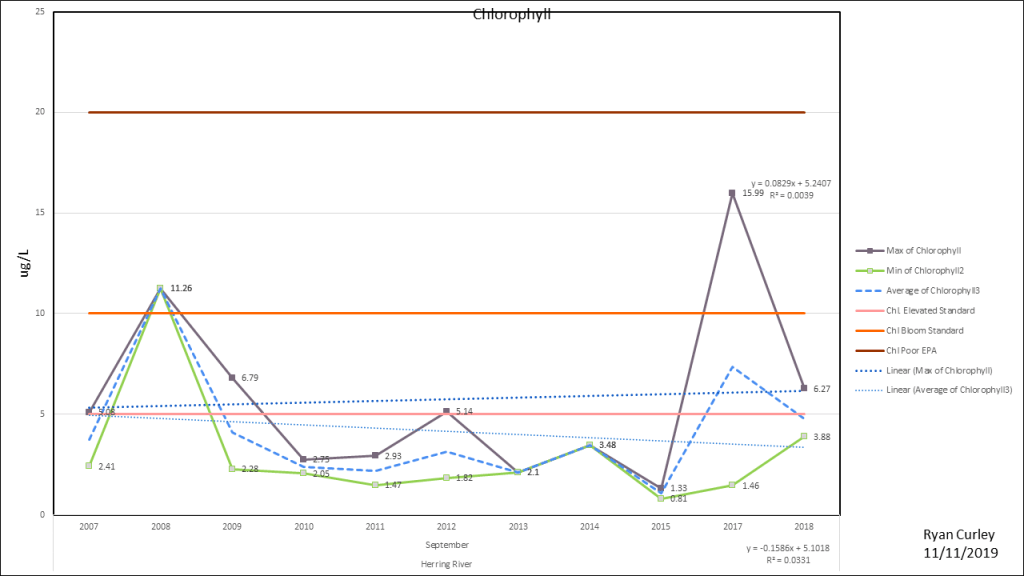
September 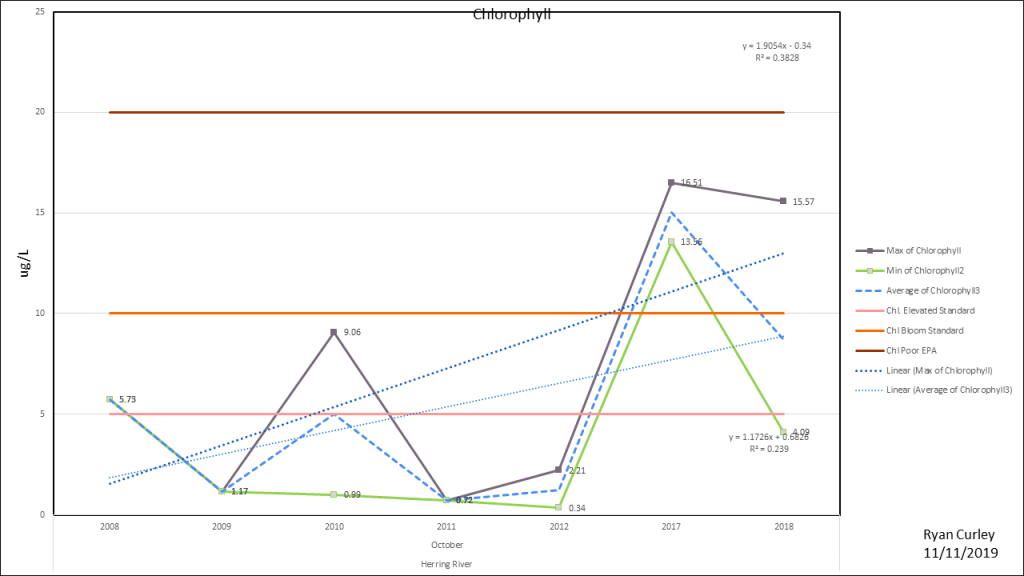
October 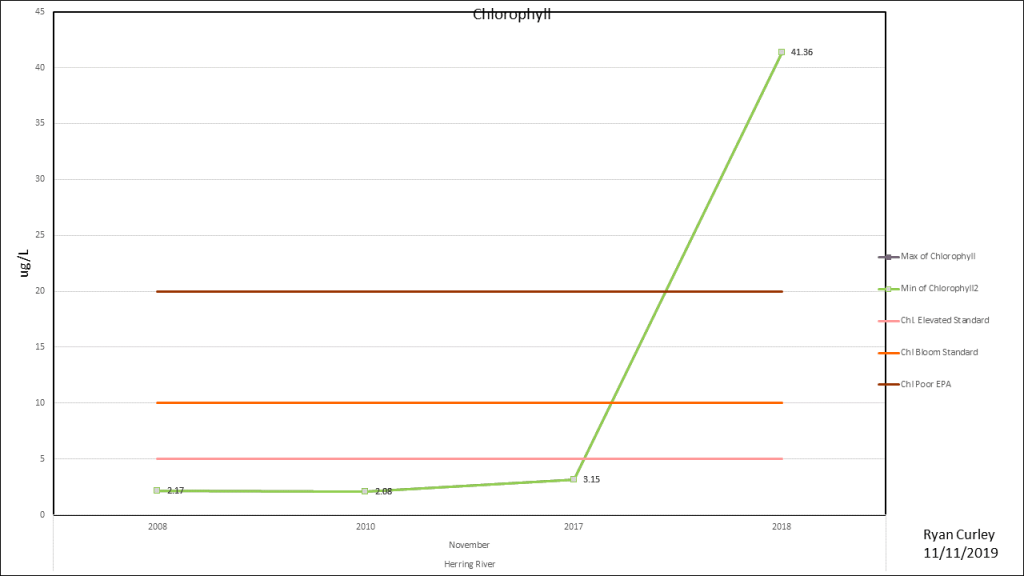
November 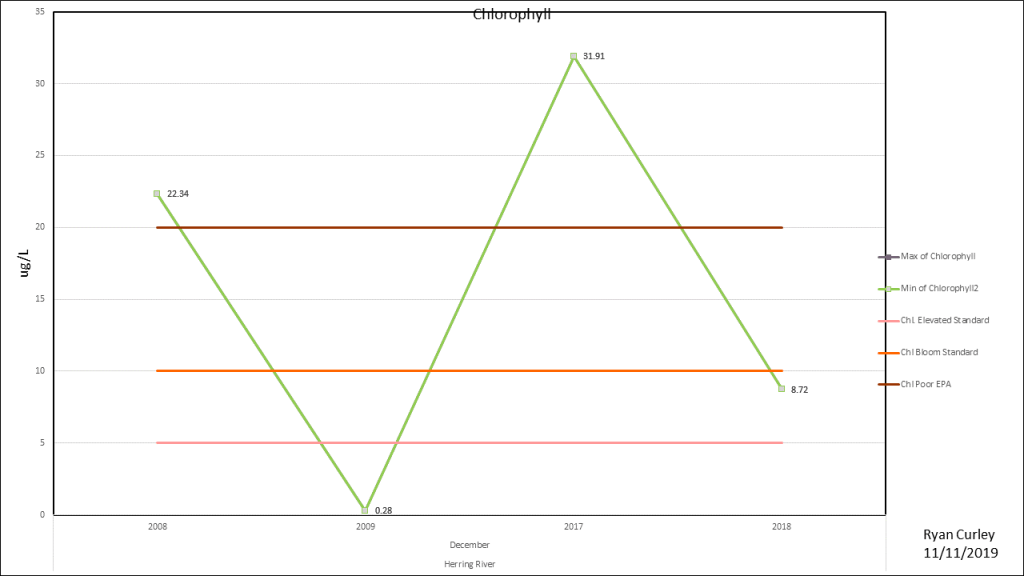
December 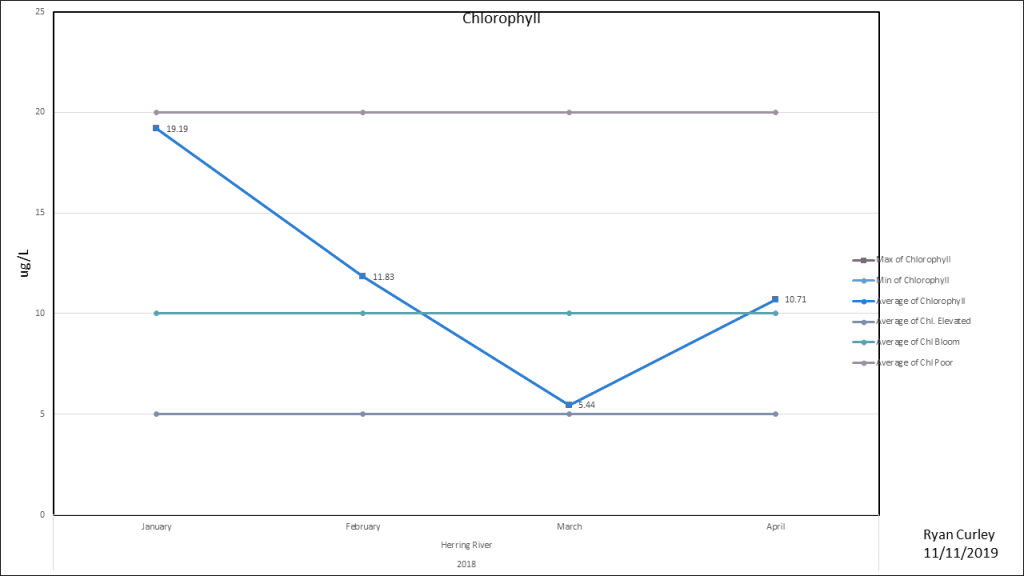
Winter 2018
Cape Cod Bay Station 5s

January 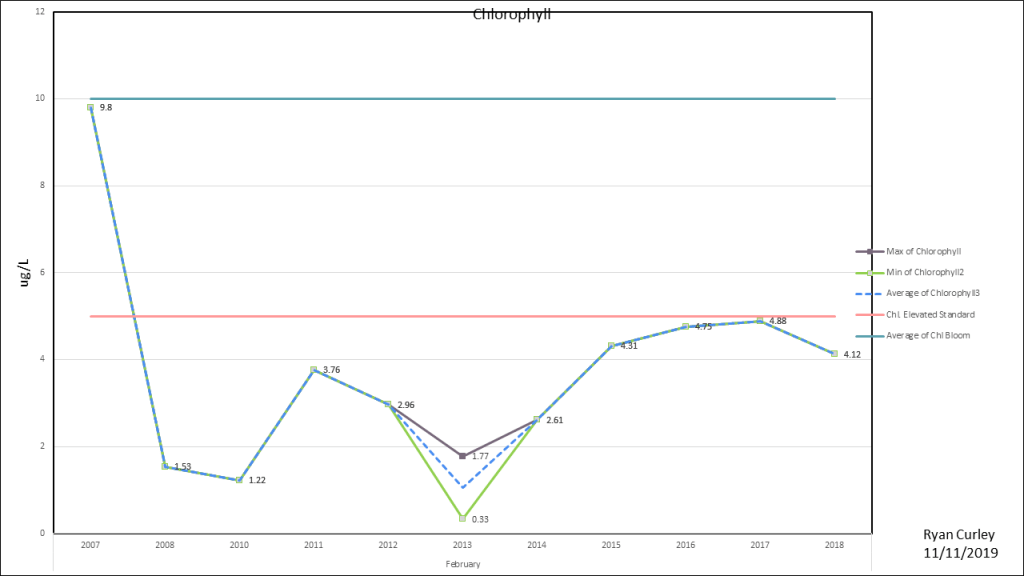
February 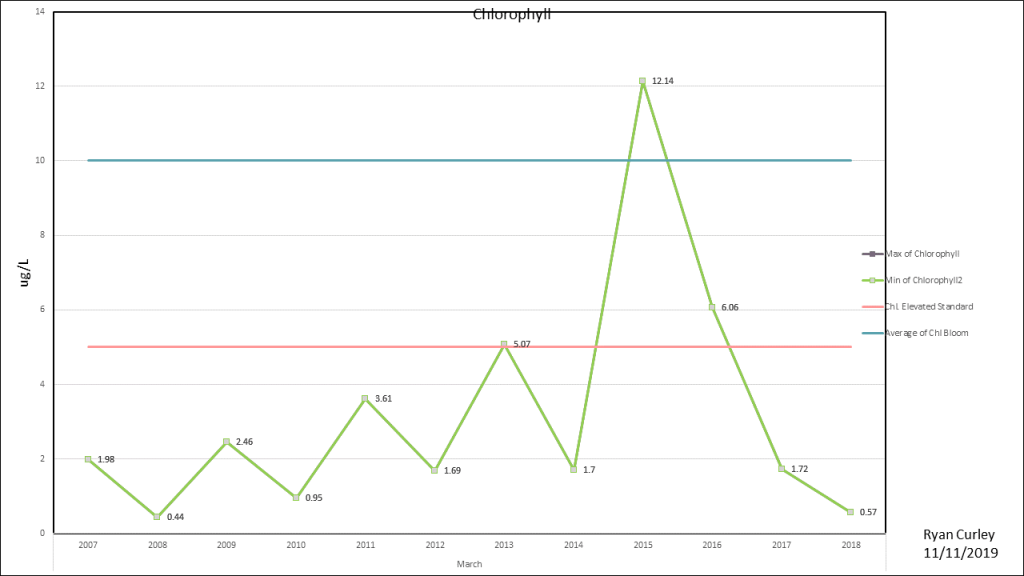
March 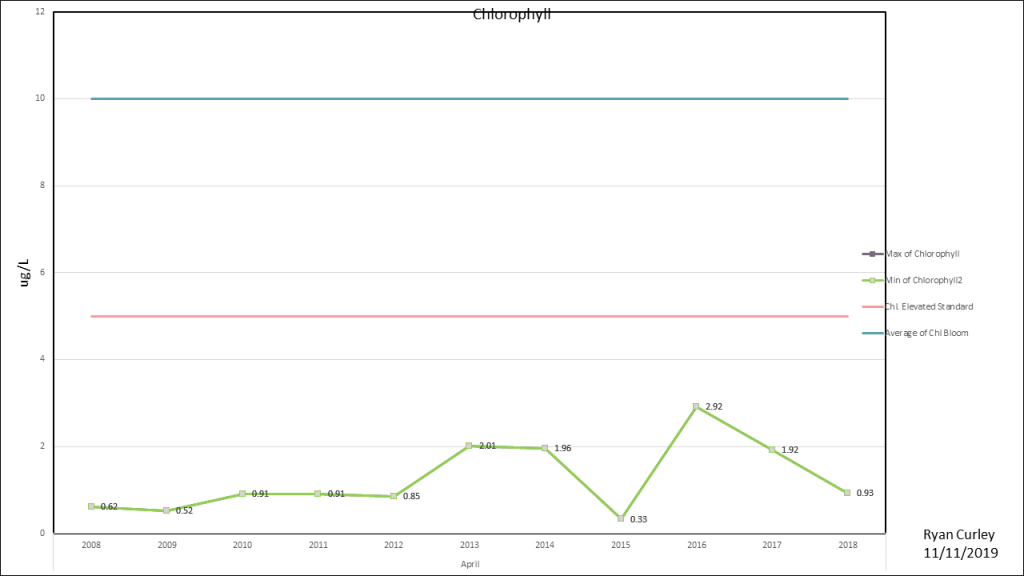
April 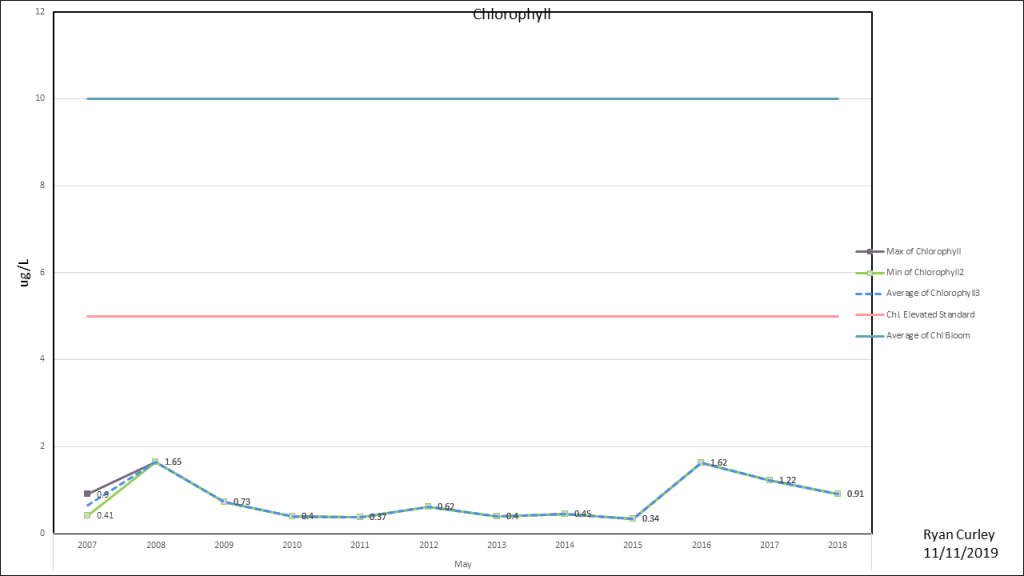
May 
June 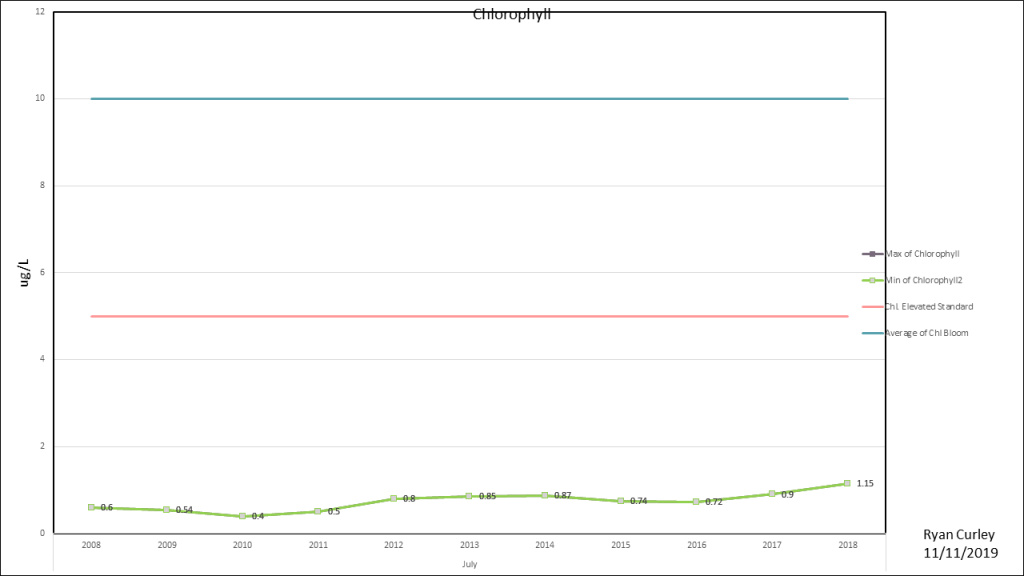
July 
August 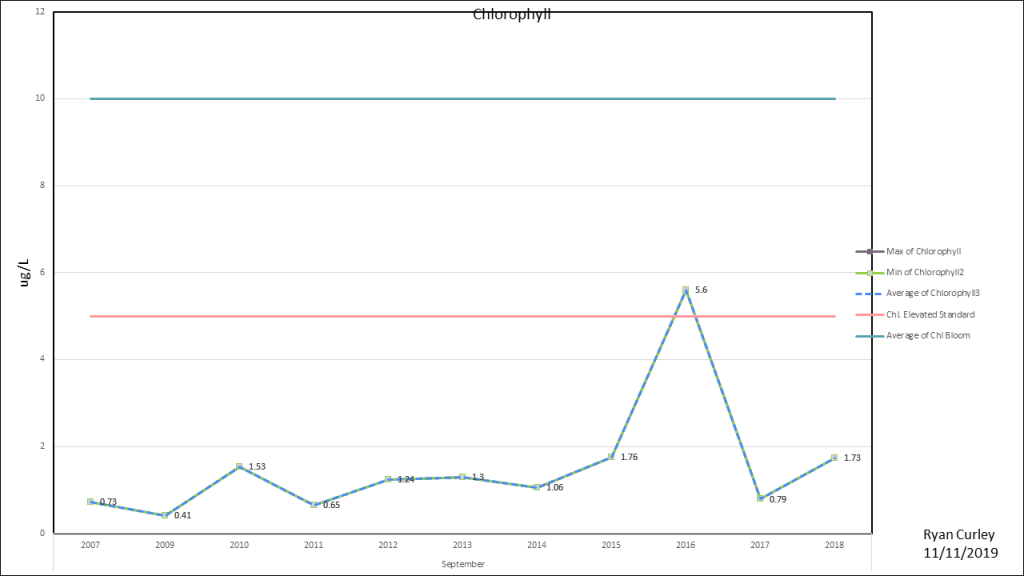
September 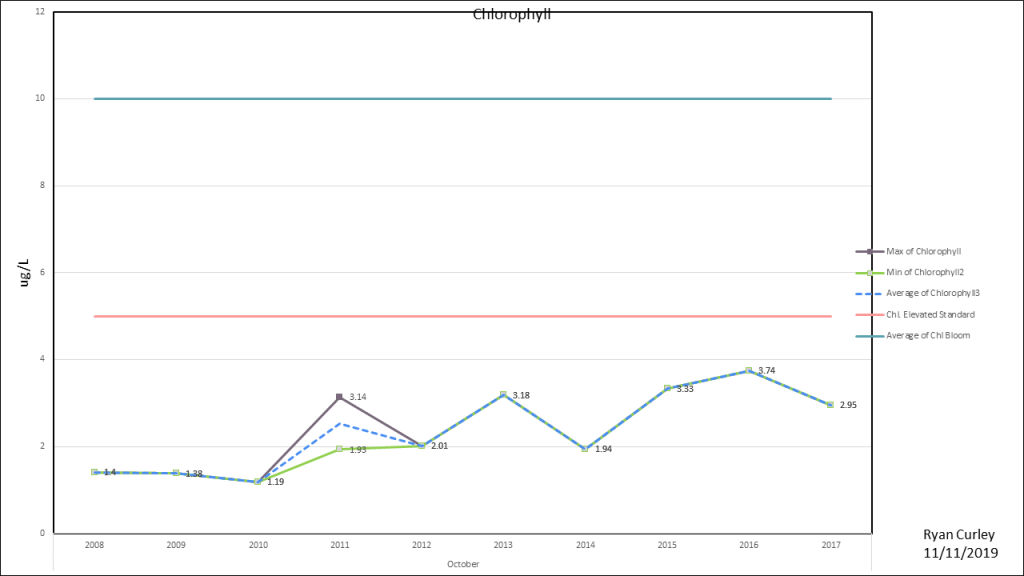
October 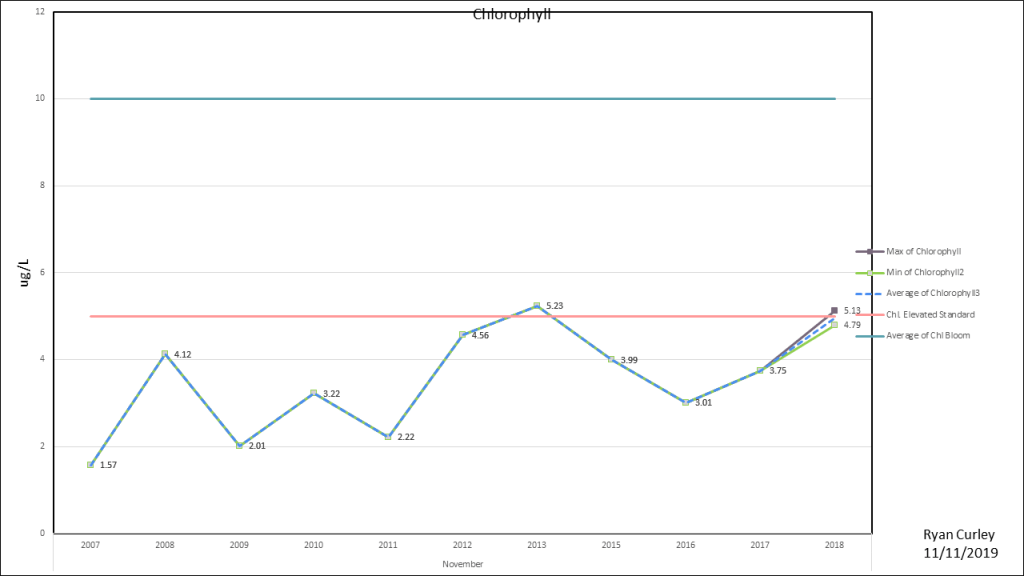
November 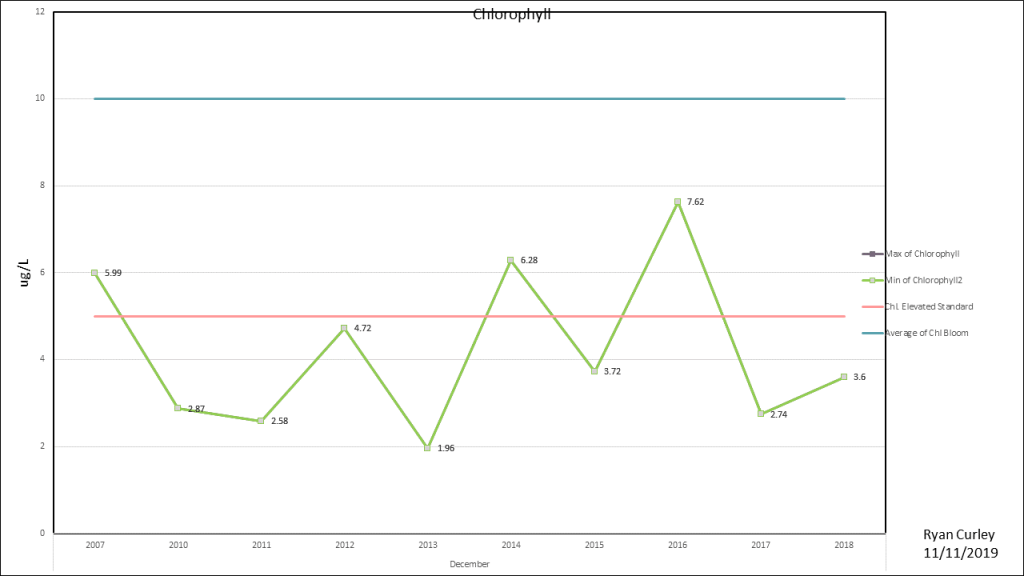
December
Duck Creek
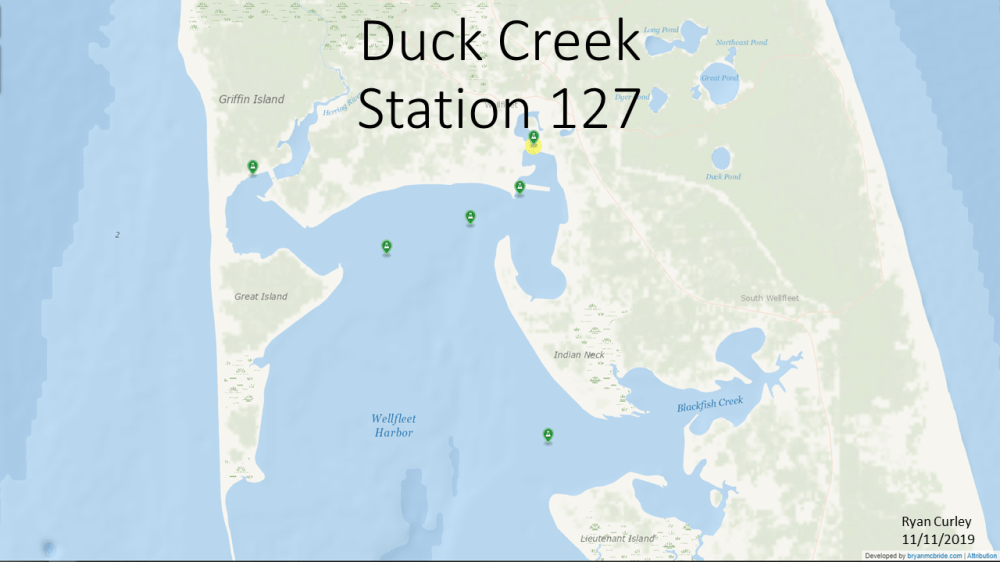
Please Note there are gaps in Duck Creek’s Chlorophyll data.
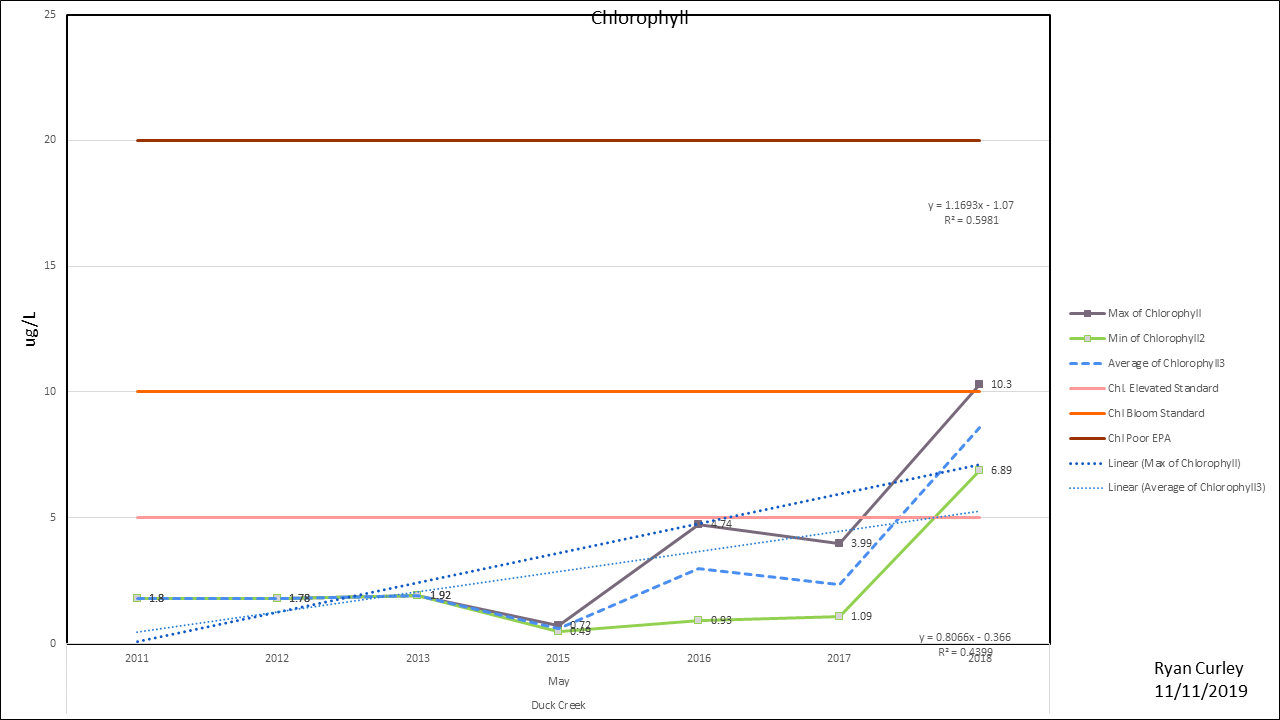
May 
June *No Data 2012, 2014 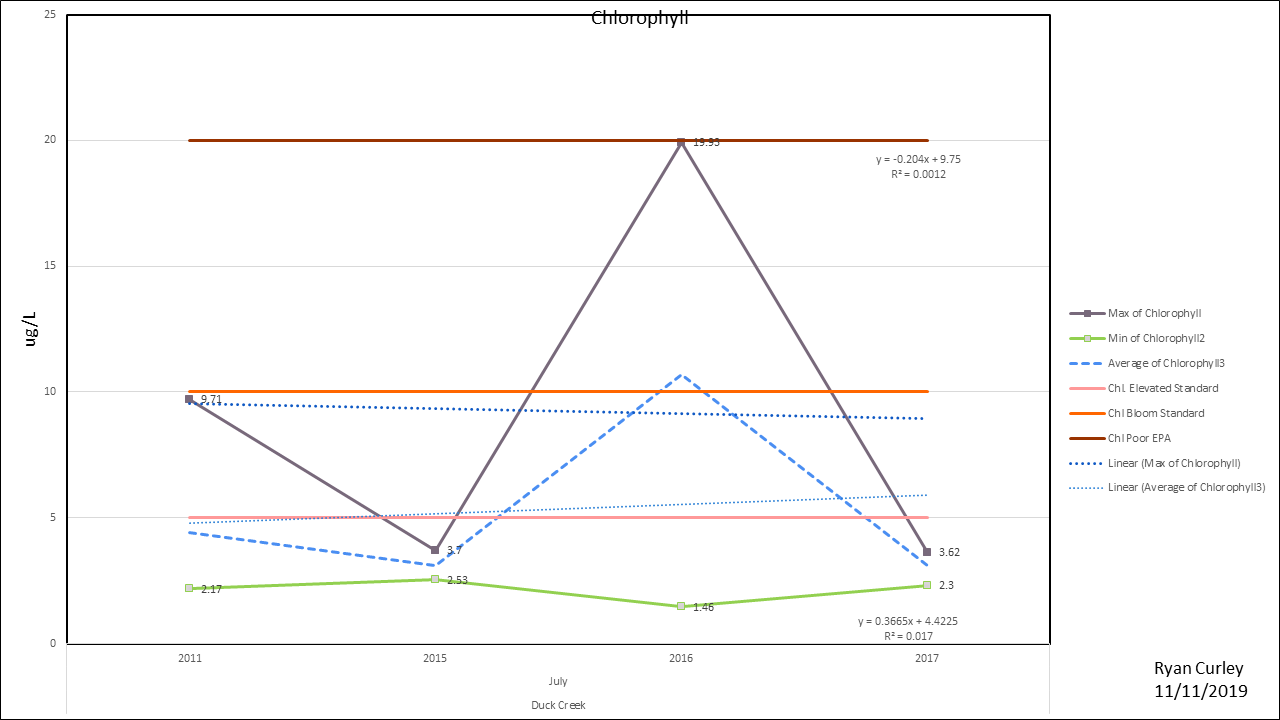
July *No Data 2012, 2013, 2014, 2018 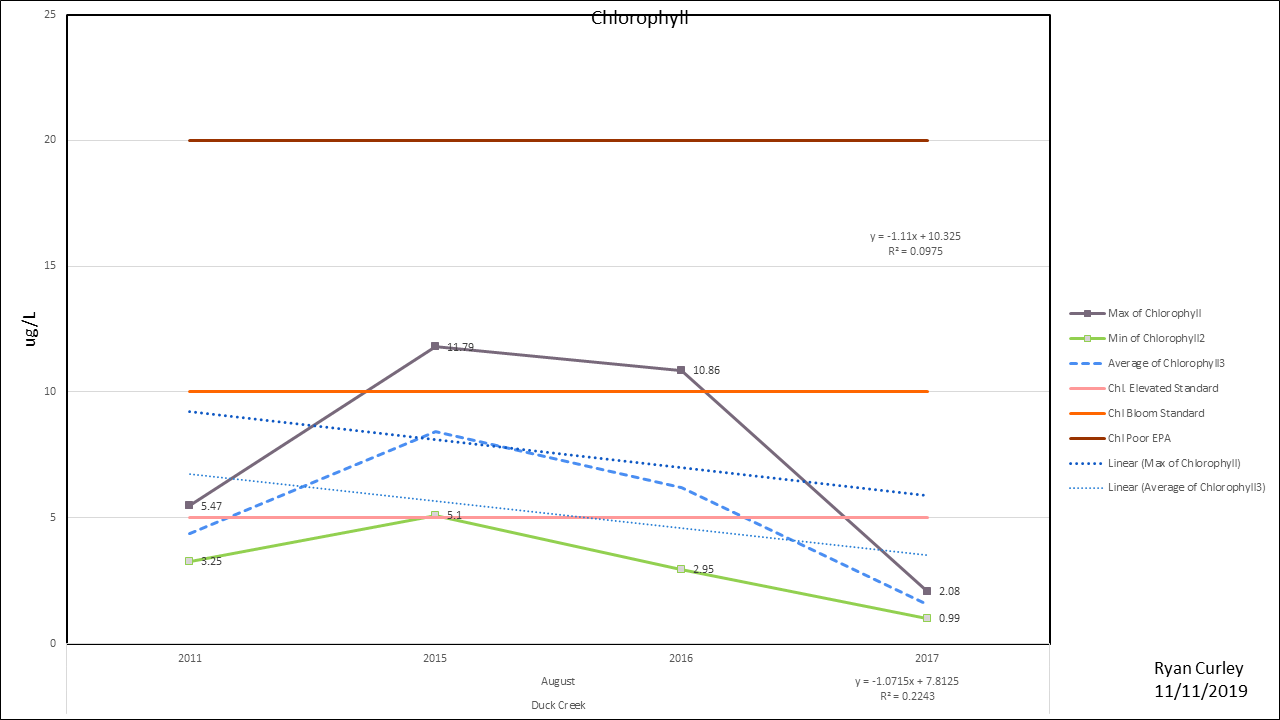
August *No Data 2012, 2013, 2014, 2018 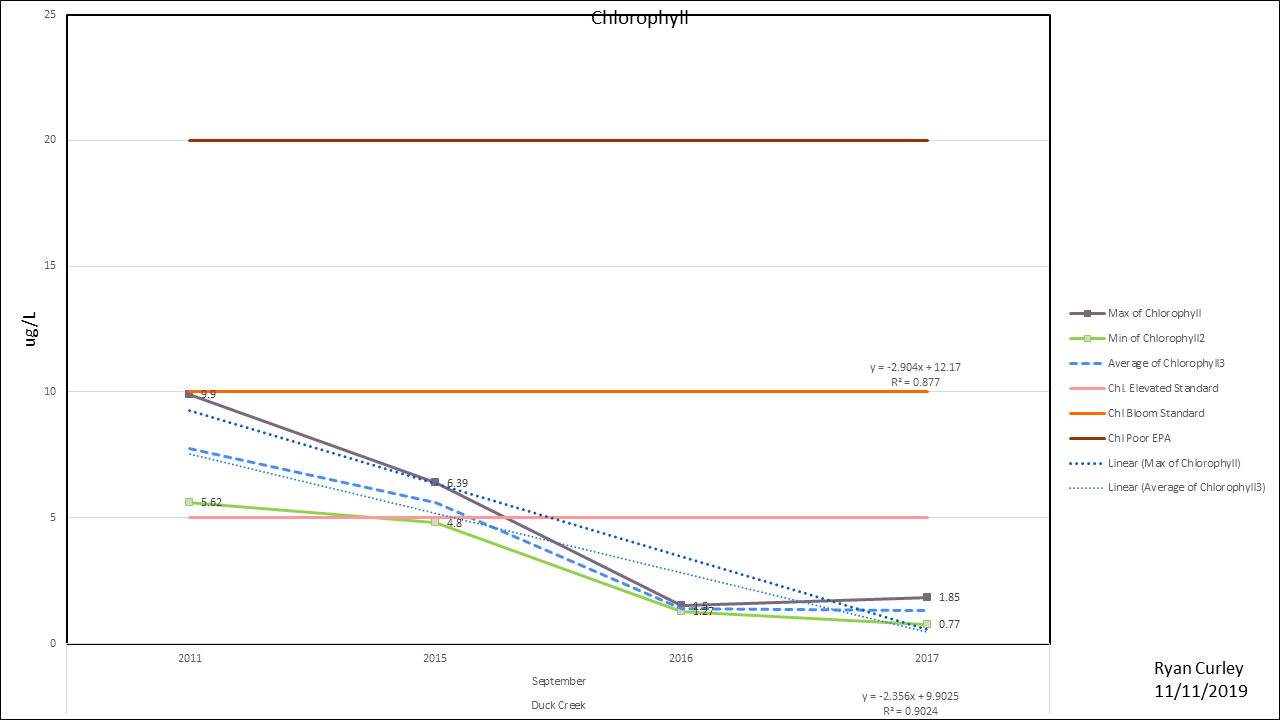
September *No Data 2012, 2013, 2014, 2018 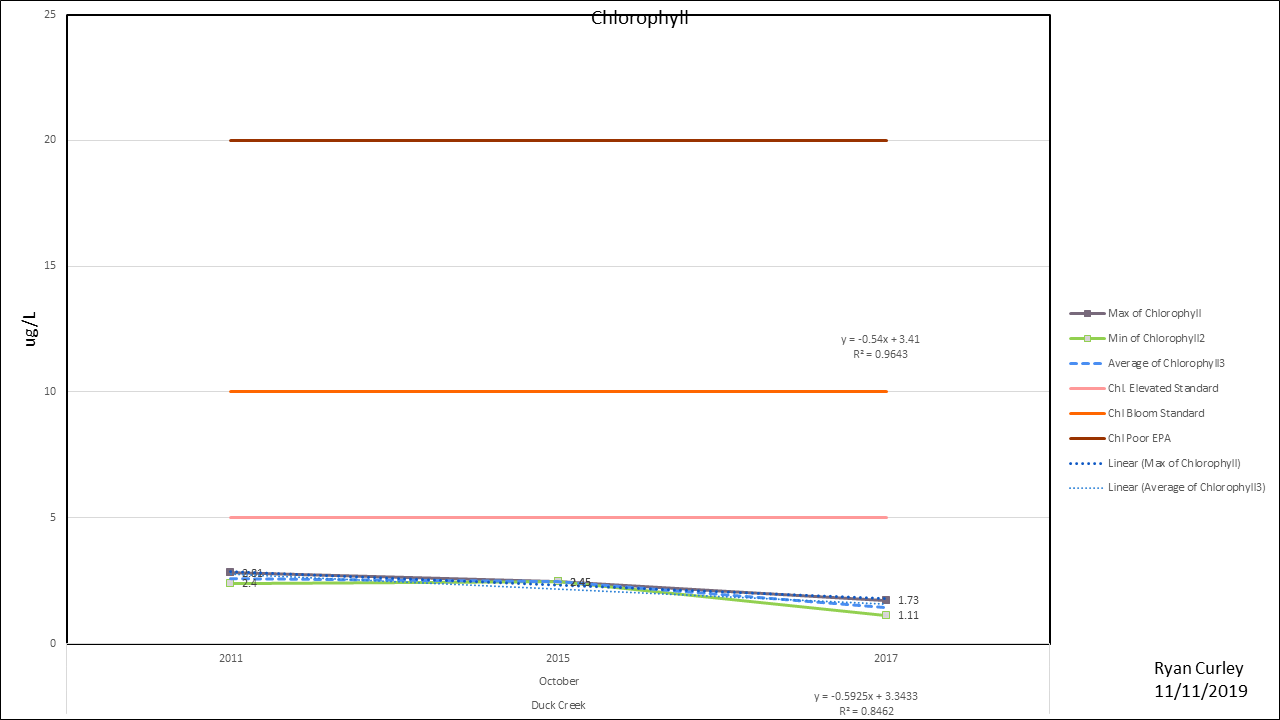
October *No Data 2012, 2013, 2014, 2016, 2018


One thought on “Chlorophyll Concentrations In Wellfleet Harbor”